Help desk metrics give you a concrete way to understand how your support team performs day to day. They focus on measurable elements of IT support work, such as how many tickets come in, how long it takes to reply, how satisfied users feel after an interaction, or how much each request costs to handle.
A good set of metrics helps you track the health of your support operations without getting lost in technical details. You can quickly spot trends in ticket volume, identify slowdowns in first response time, or see where service quality drops.
If you are looking for crucial service desk reporting metrics that will make your IT team shine, read on to find out!

What are help desk metrics?
Help desk metrics are quantifiable indicators that evaluate the performance and effectiveness of support teams. They capture operational data such as ticket volume, first response time, CSAT scores, and cost per ticket. These measurements help you understand workload patterns, service quality, and the efficiency of your support workflows.
They also provide a factual view of how requests move through the support process. Patterns in incoming demand, delays in response or resolution, and fluctuations in user feedback become visible when metrics are monitored consistently.
Metrics differ from KPIs in intent. A metric reports performance; a KPI ties that measurement to an expected outcome or target. For example, average first response time is a metric, while meeting a defined SLA for response time is the KPI that evaluates whether the metric stays within the expected threshold.
Why they matter for a service desk:
- Improve user satisfaction by identifying bottlenecks or failure points in the request flow.
- Support resource planning by showing how workloads change throughout the week, month, or season.
- Link IT support performance with business objectives through measurable service outcomes.
- Enable data-driven decisions when optimizing processes, support tiers, or tool usage.
Help desk metrics vs. KPIs
Although they have similarities, help desk metrics and Key Performance Indicators (KPIs) have different purposes and goals.
A metric is a single data point that captures what happened in the support process. It can be a time measurement, a count, or a score — for example, first response time (FRT), ticket volume, or time to resolution (TTR).
A KPI is a strategic indicator built from one or more metrics and tied to a defined objective. KPIs evaluate whether performance meets the expected target. They take raw data and link it to outcomes that matter for the service desk and the organization.
For example, FRT and TTR are operational metrics, but when you set an objective such as “reply within 15 minutes on average” or “resolve standard incidents within eight hours,” they become part of a KPI that tracks efficiency. The same metrics also support a satisfaction-focused KPI when you connect them to CSAT trends, since slow replies or resolutions often correlate with lower user ratings.

Types of service desk metrics to track in IT support
To keep the framework clear, the metrics in this article are grouped into four families. Each one focuses on a different aspect of service desk performance and helps teams understand workload, experience, speed, and cost.
- Productivity metrics measure the relationship between workload and the team’s ability to process tickets at a consistent pace. They help you assess throughput, identify pressure points in the queue, and determine when adjustments to staffing, scheduling, or workflow are needed.
- Ticket Volume – How many requests enter the service desk during a defined period.
- Ticket Backlog – Tracks unresolved tickets.
- Agent Utilization – Shows how much of an agent’s available time is spent on support tasks.
- Quality metrics evaluate the service desk’s output from the user’s perspective. They focus on the consistency, reliability, and perceived value of the support experience. These indicators help you understand how well the team resolves issues, whether service levels meet expectations, and how users judge the effort required to get help. Combined, they offer a grounded view of service quality beyond raw productivity or speed.
- Customer Satisfaction Score (CSAT) – Captures immediate feedback after a request is resolved.
- Net Promoter Score (NPS) – Measures users’ likelihood to recommend IT support over time.
- SLA Compliance – Indicates how consistently the service desk meets agreed response and resolution targets.
- Customer Effort Score (CES) – Assesses how easy it is for users to interact with support.
- Performance metrics look at how quickly and effectively the support team handles work. They help you understand response speed, resolution patterns, and workload behavior.
- First Response Time (FRT) – Time elapsed before the first reply reaches the user.
- First Contact Resolution (FCR) – Percentage of tickets resolved without follow-ups or escalations.
- Time to Resolution (TTR) – Total time required to close a ticket.
- Average Handle Time (AHT) – Time agents spend actively working on a ticket.
- Escalation Rate – Share of tickets moved to higher-tier support.
- Incident Severity – Categorization of incidents based on business impact.
- Financial metrics show the economic impact of running the service desk. They help quantify the cost of handling demand, compare internal performance against benchmarks, and support budget decisions tied to staffing, tooling, and process improvements.
- Cost Per Ticket – Average cost required to resolve a single request.
- ROI – Compares the benefits of support initiatives or tools with their total investment cost.
15 Essential Help Desk Metrics (Definitions, Formulas, Examples)
You don’t need to measure everything to keep a support operation under control. The goal is to pick the metrics that reflect how your team works, monitor them consistently, and adjust the set as your service desk evolves.
This list helps you compare indicators within the same category — productivity, quality, performance, or financial impact — so you can decide which ones align with the outcomes you want to improve.

Productivity metrics
1. Ticket volume
Ticket volume is the number of incidents or requests IT support receives and handles within a given period. It measures the workload and efficiency of the customer support team.
Formula: To calculate Ticket Volume, you need to track the number of tickets the support team receives over a specific period.
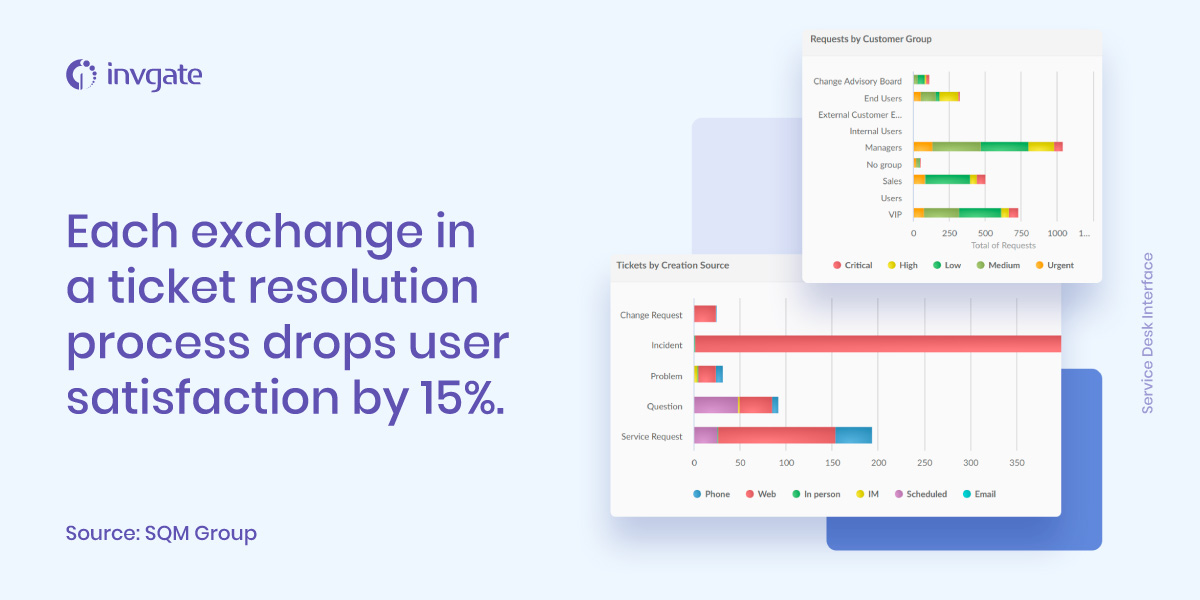
You can also break down ticket volume by channel (email, portal, phone, chat), category, priority, service, customer group, and time (hour/day/week). This way, you can use the metric to correlate spikes with releases, make configuration changes, establish alert thresholds for abnormal increases, and more.
2. Ticket backlog
Ticket backlog measures the total number of tickets that agents have not resolved in a given period. It provides insights into the IT support staff's workload, the support system's efficiency, and customer satisfaction. Analysing trends alongside a customer satisfaction survey template helps teams prioritize issues, reduce delays, improve resolution quality, allocate resources smarter, and align support performance with evolving user expectations and outcomes.
A high backlog can indicate that the IT support team is overwhelmed, leading to delayed resolution times and poor customer satisfaction.
Formula: Backlog = Open tickets at period start + New tickets − Resolved tickets
Example: Starting with 50 open tickets, receiving 40 new ones, and resolving 60 means a backlog of 30.
3. Agent utilization
Agent utilization measures the time an IT support agent spends on support-related activities compared to their total available work time.
Formula: Utilization (%) = (time spent on support tasks ÷ total available work time) × 100
Although it's mostly a simple ratio, the number can be misleading if you don’t define what “support time” includes. Two service desks using the same formula can produce very different utilization rates depending on the way they track work. That’s why this metric needs more context than just the calculation.
Not all work related to incident handling appears as direct ticket time. Investigation, follow-ups, internal discussions, escalations, and administrative tasks can consume a significant portion of the day. If you only track the time logged directly on tickets, utilization may appear lower than the actual load. If you include every activity without distinction, it may appear artificially high.
Possible measurement approaches include:
-
System-logged time (time recorded against tickets): precise for ticket handling, but doesn’t account for overhead like coordination or research.
-
Worktime accounting (timesheets or presence logs): captures a wider view of the day but offers less granularity and relies on manual accuracy.
Quality metrics
4. Customer Satisfaction Score (CSAT)
Customer Satisfaction Score measures how satisfied customers are with the IT support they receive. The CSAT metric is typically measured by asking customers to rate their level of satisfaction with the IT support they received, usually on a scale of 1-5 or 1-10.
CSAT is a leading indicator of experience quality and helps identify areas for improvement. You should track CSAT regularly, ideally after each interaction with customers.
Formula: It is calculated by dividing the total score received by the total number of responses and multiplying it by 100 to get a percentage score.
Example: If you receive 100 responses with a total score of 400 out of a possible 500, the CSAT score would be 80% (400/500 x 100).
CSAT also reflects sentiment about the entire experience, not just IT’s performance — delays caused by external teams, unclear processes, or policy decisions can lower the rating even when the agent did everything correctly.
5. Net Promoter Score (NPS)
Net Promoter Score is the customers' likelihood of recommending a company or its products/services to others. It is a widely used metric that helps organizations understand customer loyalty and satisfaction. Moreover, organizations use it to compare the performance of different products or services and to evaluate the effectiveness of changes made to customer experience initiatives.
The NPS metric is typically measured by asking customers a single question: "On a scale of 0-10, how likely are you to recommend our company/products/services to a friend or colleague?" Based on their response, customers are then classified into three categories: Promoters (9-10), Passives (7-8), and Detractors (0-6).
Formula: Subtract the percentage of Detractors from the percentage of Promoters. The Passives are not factored into the calculation. The resulting score can range from -100 to 100.
Example: If 60% of customers are Promoters, 20% are Passives, and 20% are Detractors, the NPS would be 40 (60 - 20).
Unlike CSAT, NPS is usually sent less frequently and reflects accumulated experience. Users also interpret the question differently depending on organizational culture, service expectations, or how visible IT is. A low NPS doesn’t always reflect recent performance; it may be tied to legacy issues or broader dissatisfaction with technology in the company.
6. Service Level Agreement (SLA) Compliance
Service Level Agreement Compliance measures the degree to which an IT support team meets the goals and standards outlined in their SLA. An SLA is a formal agreement between the IT support team and its customers, outlining the organization's services, the expected support level, and the timeframe for resolving issues.
- Formula: SLA compliance (%) = (Number of SLA-met tickets ÷ Total SLA-bound tickets) × 100
- Example: If 950 of 1,000 tickets meet their SLA target, compliance is 95%.
Not all SLAs reflect real user expectations. Targets set too low inflate compliance, while overly tight ones create constant misses that don’t reflect real performance. A practical approach is to review patterns in ticket types, routing, and queue ownership, then adjust thresholds in small increments instead of jumping to new numbers. It also helps to compare SLAs with internal OLAs so support teams aren’t held to promises that upstream groups can’t meet.
Classification needs a quick audit too, since inconsistent categories distort response and resolution data. A brief calibration cycle every few months usually keeps SLAs realistic without making them soft.

7. Customer Effort Score (CES)
Customer Effort Score measures how easy it was for a user to get their issue resolved or complete a request. It focuses on friction in the process rather than the final outcome.
The Customer Effort Score metric is typically measured by asking customers a single question after interacting with the support team: "How much effort did you have to put forth to handle your request?" Customers are then asked to rate their experience from "very easy" to "very difficult."
- Formula: Average of all user effort ratings (scale depends on survey design).
- Example: If survey respondents average 2.1 on a 1–5 effort scale (1 = very easy), CES = 2.1.
CES is heavily influenced by process design. Even excellent agent performance cannot compensate for workflows that demand multiple approvals, repeated information, lengthy forms, or handoffs. That makes CES a sensitive indicator of structural friction rather than individual performance.
Performance metrics
8. First Response Time (FRT)
First Response Time is the time it takes for an IT support team to respond to a customer's initial request for assistance. It doesn’t track the time it takes to resolve the issue. It is a key performance indicator used to evaluate IT support teams' responsiveness.
- Formula: Time of first agent reply − time of ticket creation.
- Example: A ticket opened at 10:00 and answered at 10:25 has an FRT of 25 minutes.
FRT ranges depend on channel (email, chat, portal). You should review natural response patterns and adjust the target so it reflects real expectations without being inflated. If the team changes routing rules or shifts to new channels, revisit the target because the baseline may shift.
9. First Contact Resolution (FCR)
First Contact Resolution is the ability of an IT support team to resolve customer issues or requests during the customer's initial contact with the support team, without follow-up.
- Formula: (Tickets resolved in a single contact ÷ total tickets) × 100.
- Example: If 70 out of 100 tickets are resolved at first contact, FCR is 70%.
When calibrating FCR targets, check which categories truly can be solved on first contact and set expectations per category instead of one global target. It’s also helpful to monitor whether support quality drops when pushing for higher FCR; if quick resolutions lead to reopen rates creeping up, the target needs adjustment.
10. Time to Resolution (TTR)
Time to Resolution measures how long it takes to fully resolve a ticket from the moment it’s opened.
To calculate TTR, subtract the time at which the customer made the request from the time at which the issue was resolved.
- Formula: Time of resolution − time of ticket creation.
- Example: A ticket created at 9:00 and resolved at 13:30 has a TTR of 4.5 hours.
TTR measures the entire time it takes to resolve the issue, including any follow-up contacts or escalations.
TTR varies heavily by incident type, so a single benchmark often misrepresents performance. Setting a global target that’s too tight forces constant exceptions, while one that’s too broad hides delays in categories that actually matter. The most reliable approach is to look at historical resolution times by category or severity and set bands that reflect real variation.
11. Average Handle Time (AHT)
Average Handle Time measures the average amount of time it takes for an IT support representative to handle a request, including the time spent talking to the customer and any associated tasks, such as research or documentation.
- Formula: Total handling time ÷ number of handled tickets.
- Example: If an agent spends 120 minutes across 6 tickets, AHT is 20 minutes.
It's important to balance AHT with other metrics, specially support quality indicators such as Customer Satisfaction, and using it as a trend metric rather than a hard target, to avoid distorting behavior.
For example, an IT support representative may be able to handle requests quickly. Still, if they don't provide effective solutions or customers are not satisfied with their interactions, AHT alone may not provide a complete picture of the quality of the IT support services.
12. Escalation Rate
Escalation Rate is the percentage of requests escalated to higher support or management levels. It measures the frequency at which issues are unable to be resolved by the initial support team and require further intervention.
- Formula: (Number of escalated tickets ÷ total tickets) × 100.
- Example: If 15 out of 200 tickets are escalated, the escalation rate is 7.5%.
Escalation rate only gives a fair picture when routing logic is stable. Any change in triage rules, queue structure, or team responsibilities can shift the rate overnight, making the metric look worse or better without any real performance change. When adjusting thresholds, check whether escalations stem from skill gaps, category misalignment, or strict permission boundaries. Set acceptable ranges per category or severity instead of applying a universal number. If the rate drops too low, verify that cases aren’t being kept at level 1 just to protect the metric.
13. Incident Severity
Incident Severity measures the impact of an IT incident on the organization's operations, services, or customers. It categorizes incidents based on the level of disruption or impact they have on the business.
- Formula: No single formula; severity is assigned using predefined criteria. Tracking how many tickets fall into each severity level (monthly or quarterly) gives you early visibility into shifts in system health or recurring high-impact issues.
- Example: An outage affecting all users might be severity 1; a bug affecting one user might be severity 4.
There are generally four levels of incident severity:
- Critical: Incidents that cause significant disruption or complete outage of a critical business process, system, or service and require immediate resolution.
- High: Incidents that cause moderate disruption to business processes or services and require timely resolution.
- Medium: Incidents that cause minor disruption and require resolution within a reasonable timeframe.
- Low: Incidents that cause minimal or no disruption and can be resolved routinely.
To assign a severity level to an incident, you have to base it on its impact and urgency. You can consider factors such as the number of users affected, the criticality of the system or service, and the potential impact on revenue.
Severity data is useful only when categories are applied consistently. If thresholds are vague, severity inflation or under-classification spreads across the queue and distorts TTR, SLA performance, and resource allocation. A periodic review of examples per category helps keep the model stable.
Financial metrics
14. Cost Per Ticket
Cost Per Ticket is the average cost of resolving an IT support ticket. It helps organizations understand the financial impact of their IT support processes and can inform decisions around resource allocation and efficiency.
- Formula: Total support cost ÷ Total tickets handled
- Example: If monthly support costs are $40,000 and the team resolves 5,000 tickets, cost per ticket is $8.
Teams decide whether to include indirect costs (training, software subscriptions, internal chargebacks). The key is to keep the model consistent so trends remain reliable.
When tracked over time, it can provide insights into the effectiveness of process changes or technology investments. For example, if a new support tool or process is implemented and the cost per ticket decreases over time, it can be seen as a sign that the investment was successful.
15. ROI
ROI stands for Return on Investment, which measures the efficiency of an investment. Organizations use it to evaluate the financial returns of investments in IT infrastructure, software, or other technology-related projects.
- Formula: (Estimated benefit − Cost of investment) ÷ Cost of investment
- Example: If a workflow automation costs $10,000 and reduces workload enough to avoid $25,000 in extra staffing, ROI is 150%.
Benefits can be direct (reduced labor hours) or indirect (higher FCR reducing business downtime). The important part is defining benefits up front so ROI calculations don’t rely on assumptions after the fact.
Tracking ROI over time allows companies to determine whether the investment was successful and whether further investments in similar technology are warranted.
How to use help desk metrics to improve IT support performance
A solid measurement model helps IT support teams understand demand, service quality, and operational cost. Metrics also give managers a clear way to link daily work with broader business goals. When tracked consistently, they guide process adjustments, staffing decisions, and service improvements.
A structured setup keeps metrics meaningful and prevents data from becoming noise. Four practical steps can help you establish a solid process:
-
Define KPIs in terms of business goals: Decide what success looks like. If the priority is better user experience, focus on CSAT, FCR, or incident severity distribution. If the focus is efficiency, prioritize metrics like FRT, AHT, and backlog trends. Setting clear goals first prevents metric overload and avoids chasing numbers that don’t matter.
-
Set up reliable tracking methods: Use your ITSM platform to automate data collection instead of relying on spreadsheets. Automated tracking reduces errors, offers consistent timestamps, and supports trend analysis over longer periods.
-
Ensure the team understands what each metric means: Agents need clarity on how their actions influence KPIs. Brief training sessions or internal guidelines help define expectations: what counts as first response, how to classify severity, or when escalations should occur. Consistency strengthens the accuracy of all metrics.
-
Use your reporting tools to review and adjust performance: Dashboards and scheduled reports give you the baseline needed for continuous improvement. Review trends, identify patterns, and adjust SLAs, staffing levels, or workflows accordingly. A regular quarterly review is often enough to keep the measurement framework aligned with operational reality.
Benefits of tracking help desk metrics
- Increase accountability and transparency across the team.
- Improve user satisfaction and retention through faster, more predictable support.
- Optimize staffing levels, workload distribution, and support costs.
- Align the service desk with business goals and service commitments.
- Make operational decisions based on actual performance data instead of assumptions.
Automating help desk reports with InvGate Service Management
InvGate Service Management makes it straightforward to automate metric tracking and remove manual reporting. Reports can be configured to include the exact indicators that matter to your service desk — such as FRT, SLA compliance, or Cost per Ticket.
To set one up, open Reports → Requests → New report, choose the metrics, specify a date range, and apply the filters you need. Once saved, you can schedule automated delivery using the clock icon and select the frequency and recipients. Reports can be sent to both licensed and unlicensed users, which is useful when sharing updates with other teams or managers.
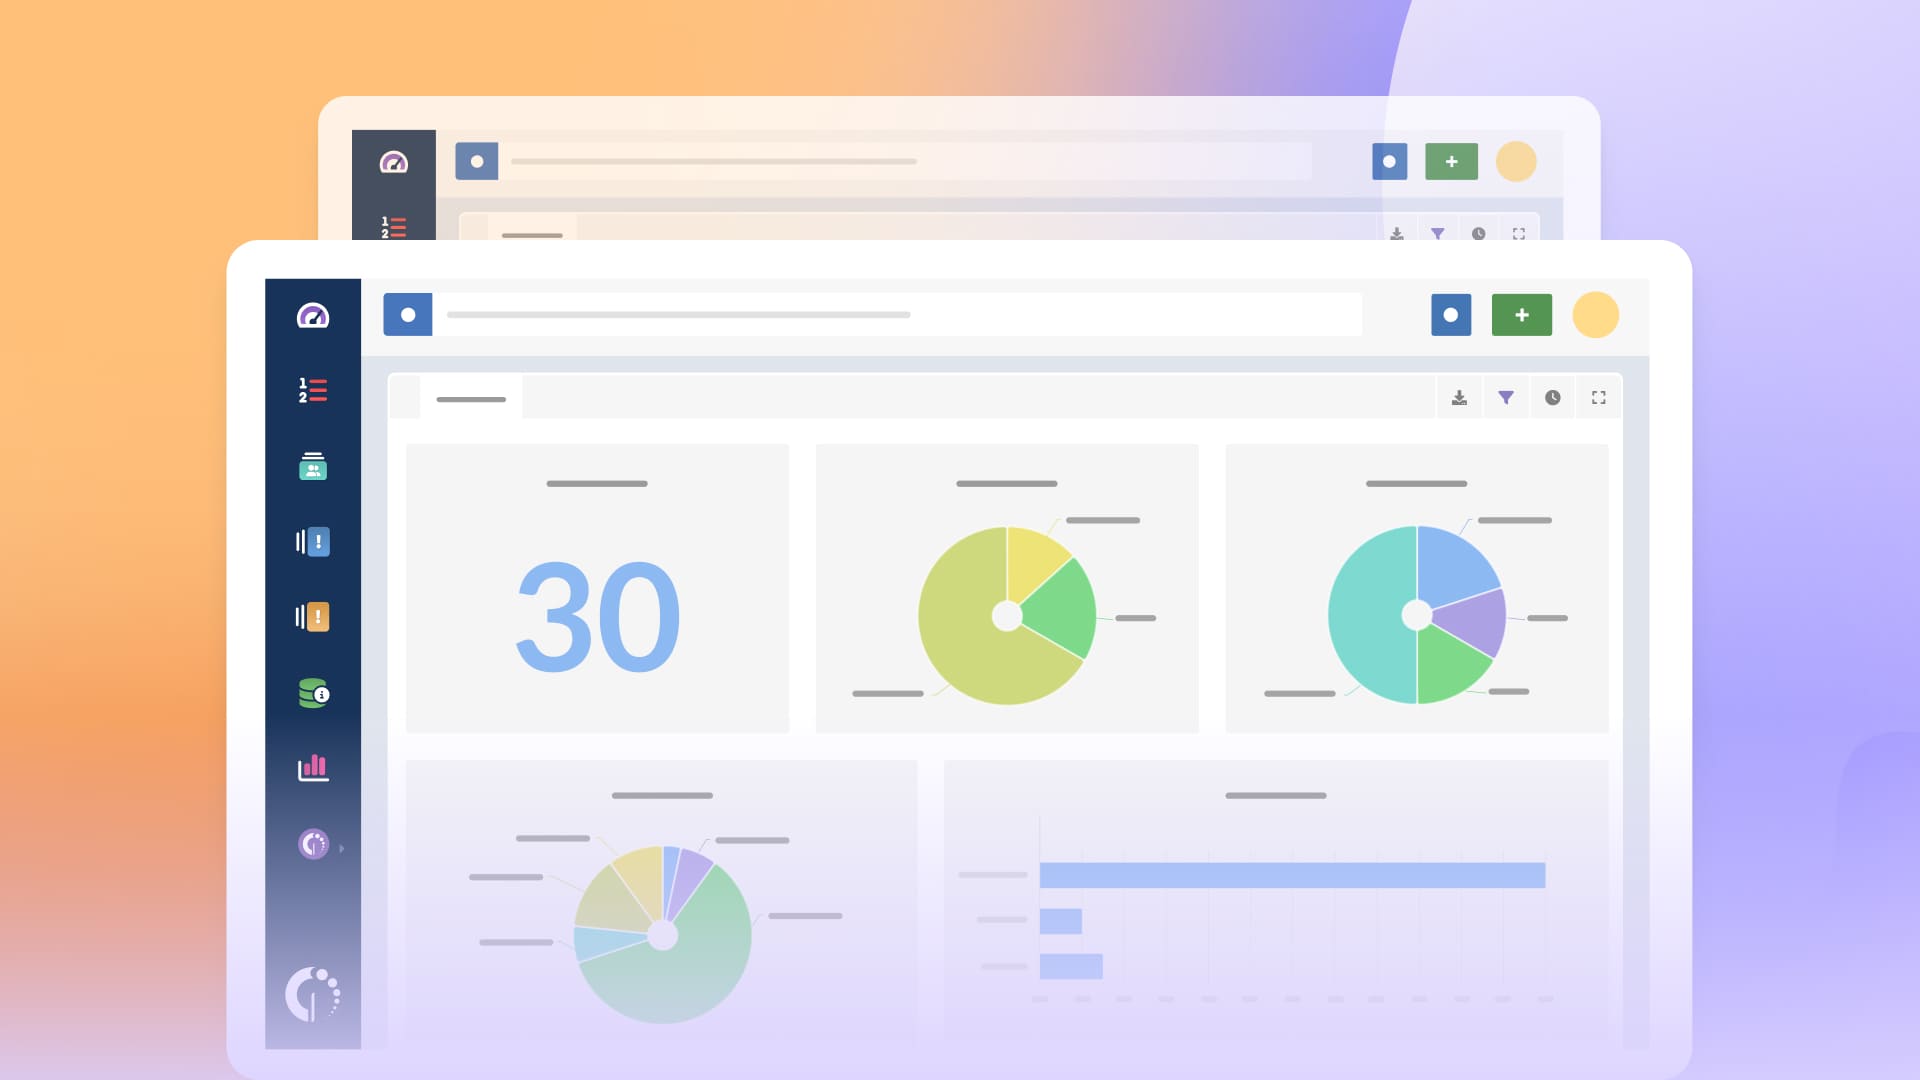
Dashboards offer a real-time view of performance. They can be customized with widgets for backlog, escalations, time to response, or financial metrics to monitor day-to-day operations. These views help detect deviations early and support faster decision-making.
Use InvGate Service Management to boost your help desk performance. Ask for a 30-day free trial and explore its reporting capabilities today!


