At this point, we all know that reporting is an essential part of IT Service Management (ITSM) and an ITSM tool. It helps us have clear information about our service desk, support the team's performance, and make better decisions.For this, there are two kinds of ITSM reporting tools that often pose a question: When it comes to dashboards vs. reports, when should I use each one?
If you find yourself having a hard time deciding, this article is perfect for you!
We’re about to see the difference between dashboards and reports and show you how to create them on InvGate Service Management in just a few clicks.

Dashboards vs reports: when to choose each one
These two reporting tools are crucial for service desk managers to examine the health and performance of the service desk and the efficiency of their teams. Let’s take a look at each one in detail.
When to use an ITSM dashboard?
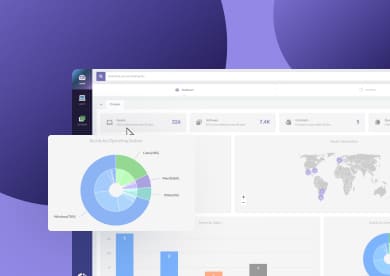
If you want a quick overview of what's going on with your service desk, ITSM dashboards are ideal. They should be every business' go-to data visualization tools, perfect for everyday analytics, quickly accessing relevant data, and Key Performance Indicators. They showcase the general state of operations with graphic data visualizations.
ITSM dashboards help you to have a broad idea of your service desk data and your team’s work.
Dashboards are completely customizable on InvGate Service Management, meaning:
- You can choose the dashboard design with the visuals that work best for you.
- You can design your own dashboards and highlight key help desk metrics as you prefer.
- You can decide which ones you want to see on your main menu.
You can also share them with other stakeholders so that they see the measurements from their teams. Overall, dashboards are the best option for accessing live data, making reality checks, and quickly validating work-in-progress.

When to use ITSM reports?
On the other hand, we have ITSM reports for more detailed data. They are the best option for capturing performance from a precise period and using more complex data sets. Typically, they provide you with a datasheet with all the information you filter when creating it.
So, reports will help you perform data analysis, have a detailed snapshot of the service desk performance in a moment in time, complete business metrics, and allow for executive management follow-up.
ITSM reports examples
InvGate Service Management classifies reports by:
- Reports on requests: metrics of requests, SLAs qualification, etc.
- Reports on time tracking: related to the time-tracking feature, this type of report allows you to analyze the agents’ work time on tickets.
- Interval reports: related to time lapses; this type of report shows information related to the intermediate status of the tickets, even when they have not been closed.
Another great detail is that you can share reports with unlicensed users to analyze the data and make better decisions.

Dashboard vs report: Key differences
So, as we covered, dashboards and reports are both essential tools for visualizing and analyzing data, but they serve different purposes and are used in distinct ways. Let's explore this in more detail:
Purpose and usage:
- Dashboards:Dashboards: Designed for real-time monitoring, data dashboards provide an at-a-glance view of key metrics and performance indicators. They have interactive elements and can be customized to show the most relevant data for specific teams or objectives. Dashboards are often used to assess business performance, get actionable insights, and make quick decisions.
- Reports: Typically static and more detailed, reports are used to present data over a specific period. They are often used for comprehensive analysis, documentation, and record-keeping. Reports provide a structured format for reviewing past performance, understanding trends, and supporting strategic planning.
Data analysis and refresh:
- Dashboards: Usually connected to live data sources, dashboards update in real-time or at frequent intervals, allowing users to see the most current information available.
- Reports: Unlike dashboards, reports are generated at a specific point in time. They capture and present data from a particular period, making them less dynamic but more suitable for detailed analysis.
Interactivity:
- Dashboards: Often interactive, allowing users to drill down into data, apply filters, and customize the view to focus on specific areas of interest.
- Reports: Generally static, with data presented in a fixed format. While some reports may allow for basic interactivity, such as sorting or filtering, they are primarily designed for reviewing and sharing information.
Audience:
- Dashboards: Typically used by operational teams, managers, and executives who need to monitor specific metrics and make decisions quickly.
- Reports: Often aimed at stakeholders who require a detailed understanding of the data, such as analysts, auditors, and decision-makers involved in long-term planning.
Data visualization:
- Dashboards: Focus on visual elements like charts, graphs, and gauges to convey information quickly and effectively.
- Reports: Combine text, tables, and visuals to provide a thorough explanation and analysis of the data.

Using dashboards and reports in InvGate Service Management
Now that you know when it’s best to use dashboards and reports, it’s time to see how to create them on InvGate Service Management.
How to create dashboards on InvGate Service Management

To start, you must know that InvGate Service Management comes with five predefined dashboards on the dashboard view:
- Backlog
- Customer Satisfaction
- Request management metrics
- SLAs metrics
- Times
Nonetheless, you might need new and more specific dashboards for your day-to-day work. You can create new ones in two ways:
- Click on the ‘+’ button next to the name of the preset dashboard on the dashboard view.
- Copy an existing dashboard and modify it as needed.
Setting up charts for the recently created dashboards is a pretty intuitive process: You just need to define the visualization style and select the metric, dimension, and drill-downs. And that’s it— your new chart is good to go!
Since InvGate Service Management allows you to share dashboards between different users, it’s a helpful way for others to get a real-time view of different operations.
Plus, thanks to our auto-refresh feature, dashboards can be displayed on screens, showing a general view of the operations at any given time.

How to create reports in InvGate Service Management
The InvGate Service Management reporting feature is a powerful way to slice, dice, visualize, and store your most crucial performance information.
To get started, click on the “Reports” menu, go to “Requests,” and create a new report. Then, choose the specific metrics you want to be featured— and remember to include a date range. Done— your report is ready!
You can always save it if you want to go back to it in the future, share it with non-licensed users, and even automate it to be sent to your email address periodically.
Keep in mind that once you know what you want to report on – or even if you don’t – going to the data and exploring is one of the best ways to get started.

Final thoughts
ITSM reporting tools are one of the many perks of providing support with help desk software. Unlike, say, channeling requests using just email, InvGate Service Management allows you to analyze and act upon all the data involved in your IT operations.
And now, thanks to this comparison, you'll have it all figured out the next time you need to use a reporting tool!
Both reports and dashboards are essential tools for data analysis and communication, but they serve different purposes. In short:
- Dashboards are a visual way to understand what’s going on with your service desk in real-time.
- Reports show you a snapshot of a precise moment in time to understand more complex KPIs.
Since InvGate Service Management allows you to customize both and share them fully with non-licensed users, and you’ll have the freedom to choose and see exactly what’s useful for you and your team.
Don’t forget to get a 30-day free trial and see for yourself how they work on InvGate Service Management.


