An ITSM dashboard is your de facto control center for everything related to Service Management. It should be clear, detailed, versatile, and offer a single-glance way to get the necessary information. Otherwise, you risk mismanaging your IT assets and operations because you missed valuable data points. However, it’s not easy to design a dashboard that allows everyone — from upper management to rank-and-file employees — to access strategically important, actionable IT Service Management (ITSM) information on a dime. Yet, the endeavor not being easy doesn’t make it any less necessary for decisions that have a positive impact.
Also, we know you don’t want to be coding your way into a competent dashboard. You may have a dedicated coding team, but trust us when we say that you don’t want to waste their time (and your money) when good ITSM tools should come with certain features ready to go.
At InvGate, we created our InvGate Service Management dashboards with this in mind to provide you with versatile, easy-to-configure, and easy-to-share tools to make your daily job easier.
Let's take a look!

Why should you implement dashboards?

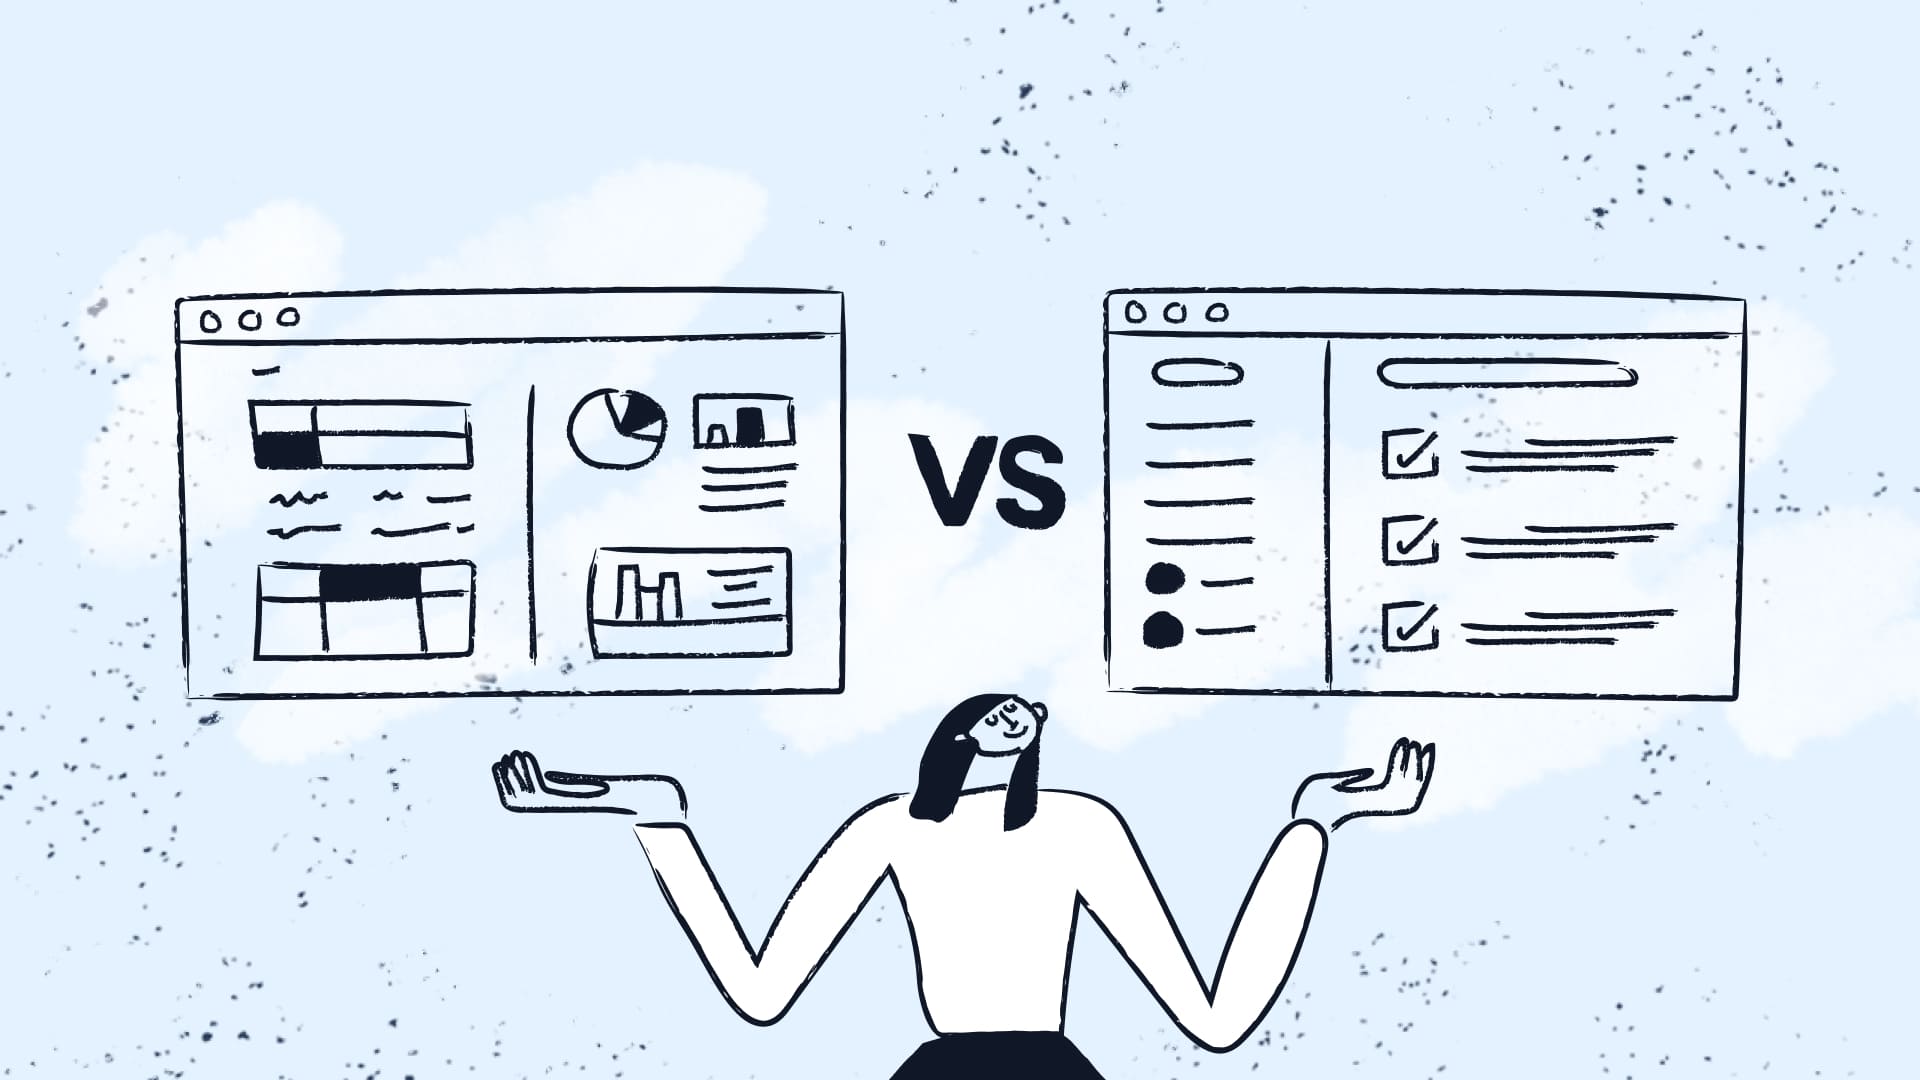
Effective ITSM dashboards offer a powerful way to manage and monitor service desk software operations. Unlike reports, which provide a detailed, historical view of your data, dashboards present real-time information related to your Service Management practices.
The value of having access to that information day-to-day is that it can help you identify areas of improvement and trigger quick responses. They help you stay on top of current activities, allowing you to make informed decisions quickly.
The ability to view and analyze current data on your dashboard means that decisions are based on what's happening right now—not on outdated or incomplete information. Whether you're reallocating resources to manage a queue tickets or adjusting your SLAs, dashboards provide the real-time insights you need to make informed choices.

The benefits of effective ITSM dashboards
We know that ITSM dashboards give you a complete view of your operations. Here are the key advantages that make them indispensable for organizations:
-
Measure quality and performance of service desk operations.
-
Effectively track open incidents, response times, and resolution rates.
-
Better decision-making and problem-solving.
-
Identify areas for improvement and optimize processes.
-
Increased efficiency, productivity, and customer satisfaction.
-
Enhanced communication and collaboration.
So, to enjoy those benefits, what should your ITSM dashboard be able to do?
-
Present information in a way that’s as clear and concise as possible.
-
Collect and present data in real time.
-
Allow you to monitor and analyze information to be proactive and predictive rather than reactive.
-
Let you assess situations as they happen.

What can you use your dashboard for?
A good dashboard design will give you visibility and control over whatever ITSM metrics you require. For us, these are the six things your tool must provide you with.
Tracking real-time performance
Use your dashboard to monitor real-time ticket response times, resolution rates, and other help desk metrics. This immediate access to data allows your team to react swiftly to issues, ensuring service levels are consistently met, and bottlenecks are resolved before they escalate.
Visualize data interactively
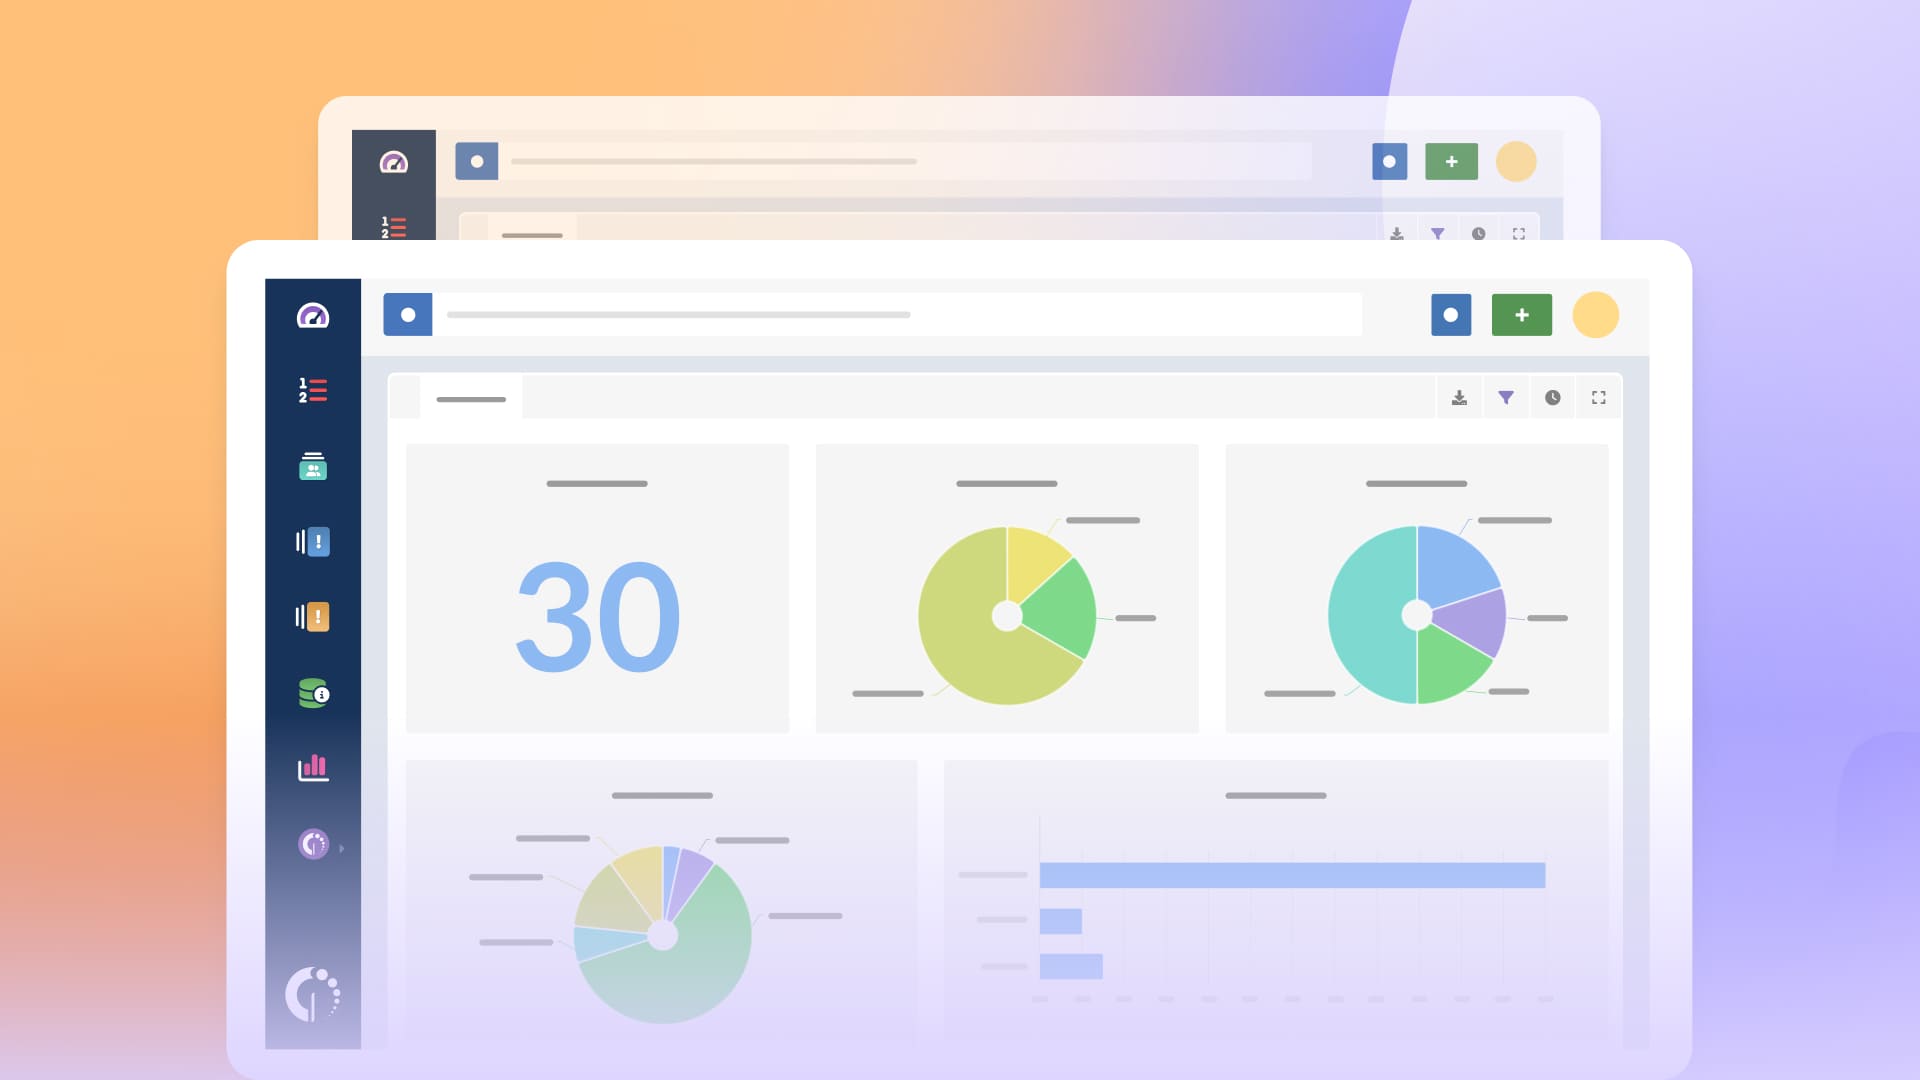
Your dashboard will include interactive charts, graphs, and other visual elements that make it easy to interpret data at a glance. These visuals should be intuitive, allowing users to drill down into specific metrics for deeper analysis without overwhelming them with unnecessary details. The goal is to provide a clear, digestible overview that can be explored further as needed.
Have a quick grasp of goals and timelines
Dashboards can provide a clear view of your progress toward goals, with visual indicators showing whether you're on track or falling behind. You can use a deviation graph to visualize the difference between your goals and actual performance.
This helps quickly identify and address any delays or obstacles, keeping your team aligned with key objectives and ensuring that resources are allocated effectively.
Aligning the team with shared views
Use your dashboard to present a unified perspective all team members can access. This shared single view ensures that everyone works with the same information, reducing miscommunication and conflicting priorities. With a consistent, team-wide dashboard, collaboration becomes more straightforward, and decision-making is based on a single, accurate source of truth. chart chart

The 8 Ws of ITSM dashboard design
No matter what your organization deigns essential, the same principles apply to designing your dashboard. The underlying principles (or the 8 Ws) are:
-
What role? Identify who will use the dashboard and what information they need.
-
What to push? Show the key information needed to meet your organization’s goals and policies.
-
What to pull? Include data that isn’t immediately visible but can be accessed when needed.
-
What is prior? Use past data to spot trends, alongside real-time information for a complete view.
-
What is visual? Make sure the data is clear and easy to understand with charts and graphs.
-
What placement? Arrange items logically to help users find what they need quickly.
-
What’s related? Allow users to see detailed information or a general overview as needed.
-
What’s optional? Show only the most relevant information and adjust based on available space and needs.
Dashboards in InvGate Service Management

As we already said, ITSM dashboards are a powerful tool for service desk agents and managers to monitor and improve performance. With InvGate Service Management, dashboards offer an at-a-glance view of your service desk operations, providing real-time reality checks and quick validation of work in progress.
These views can spotlight specific issues, such as a critical incident in progress, or reveal trends, like a surge in tickets on a particular topic. InvGate Service Management dashboards can be shared with anyone in your company without requiring additional licenses, making it easier to keep everyone aligned, from the front-line staff to upper management.
However, it's essential to note that sharing is controlled by access permissions—team members will only see the data they are authorized to view. For example, an HR Service Desk team member will only see HR-related dashboard data unless granted observer rights to another team’s dashboard.
You can make any dashboard your default view, share it with others, or even create a copy for further customization. Pre-built templates simplify setup, and you can set them as default or duplicate them for tailored adjustments. Other essential features include export, filter, auto-refresh, and full-screen options.
The dashboard feature also has many customization options. The configuration screen is straightforward, allowing you to visualize measurements in various ways.
For example, you can display requests by priority and drill down further to see whether they were incidents, requests, problems, or change records. Adding conditions lets you refine the data displayed, making it easy to focus on specific metrics.
So, what do we offer?
-
An intuitive ticketing solution with a clear view of your service desk that lets you track relevant metrics (the ones you decide) and take action when needed.
-
A way to make your agents’ lives easier, with quick views that help spot process bottlenecks, track high-priority incidents, monitor workload distribution, and more.
-
Insights for your team to work smarter, not harder.
And hey, you don’t have to jump in and take our word for it. You can opt for our 30-day free trial and let the results speak for themselves.
In conclusion
Clear, intelligent ITSM dashboards are a Service Management must. As you know, data drives decisions, and you need the right data to make the correct choices.
If you're here, it's clear that you already care about your Service Management and the quality of your services. Dashboards can help you maintain service quality while efficiently handling customer requests. They're a great tool for tracking performance, monitoring progress toward goals, and staying aligned with important objectives.
A well-designed ITSM dashboard can open the door for your team to deliver higher-quality services, respond to customer needs more effectively, and achieve your organizational goals.
For InvGate Service Management, we've reimagined the traditional execution of dashboards and created a new style that not only presents the information you need but also allows the user to interact directly with data.


