










IT KPIs help IT teams measure service performance, assess reliability, and demonstrate how technology investments support business goals. The right indicators give IT leaders a clear view of operational results and provide evidence for decisions about resources, priorities, and spending.
This guide covers 12 IT KPIs, organized by what they measure, the metrics to include in an executive dashboard, and how CIOs can use performance data to support headcount requests.
A KPI earns its place when it proves something to someone outside IT. Drawn from the wider pool of service and operations metrics a team can track, the twelve below each answer a specific business question — grouped here by what they prove.
These are the typical day-to-day service desk KPIs the operation lives by: how fast tickets get answered and closed, and whether users feel supported.
Reliability is what leadership notices most when it’s missing. These track whether services stay up and whether the changes IT ships land safely.
The cost side of the story. Some come from the service desk; others from the way hardware and licenses are tracked across their lifecycle.
 The 12 KPIs serve as a reference for selecting the metrics most relevant to your organization. An executive dashboard should focus on four to six indicators that address key business priorities: service responsiveness (first response time or backlog age), reliability (uptime), service commitments (SLA compliance), user experience (CSAT), and cost efficiency (cost per ticket). Select the metric that best reflects each priority and retain more detailed operational measures in the reporting system.
Reporting frequency should also reflect the audience and purpose. Service desk teams may benefit from real-time dashboards for monitoring workloads and responding to emerging issues. Executive reviews typically call for weekly or monthly reports that highlight trends, performance against targets, and areas requiring attention.
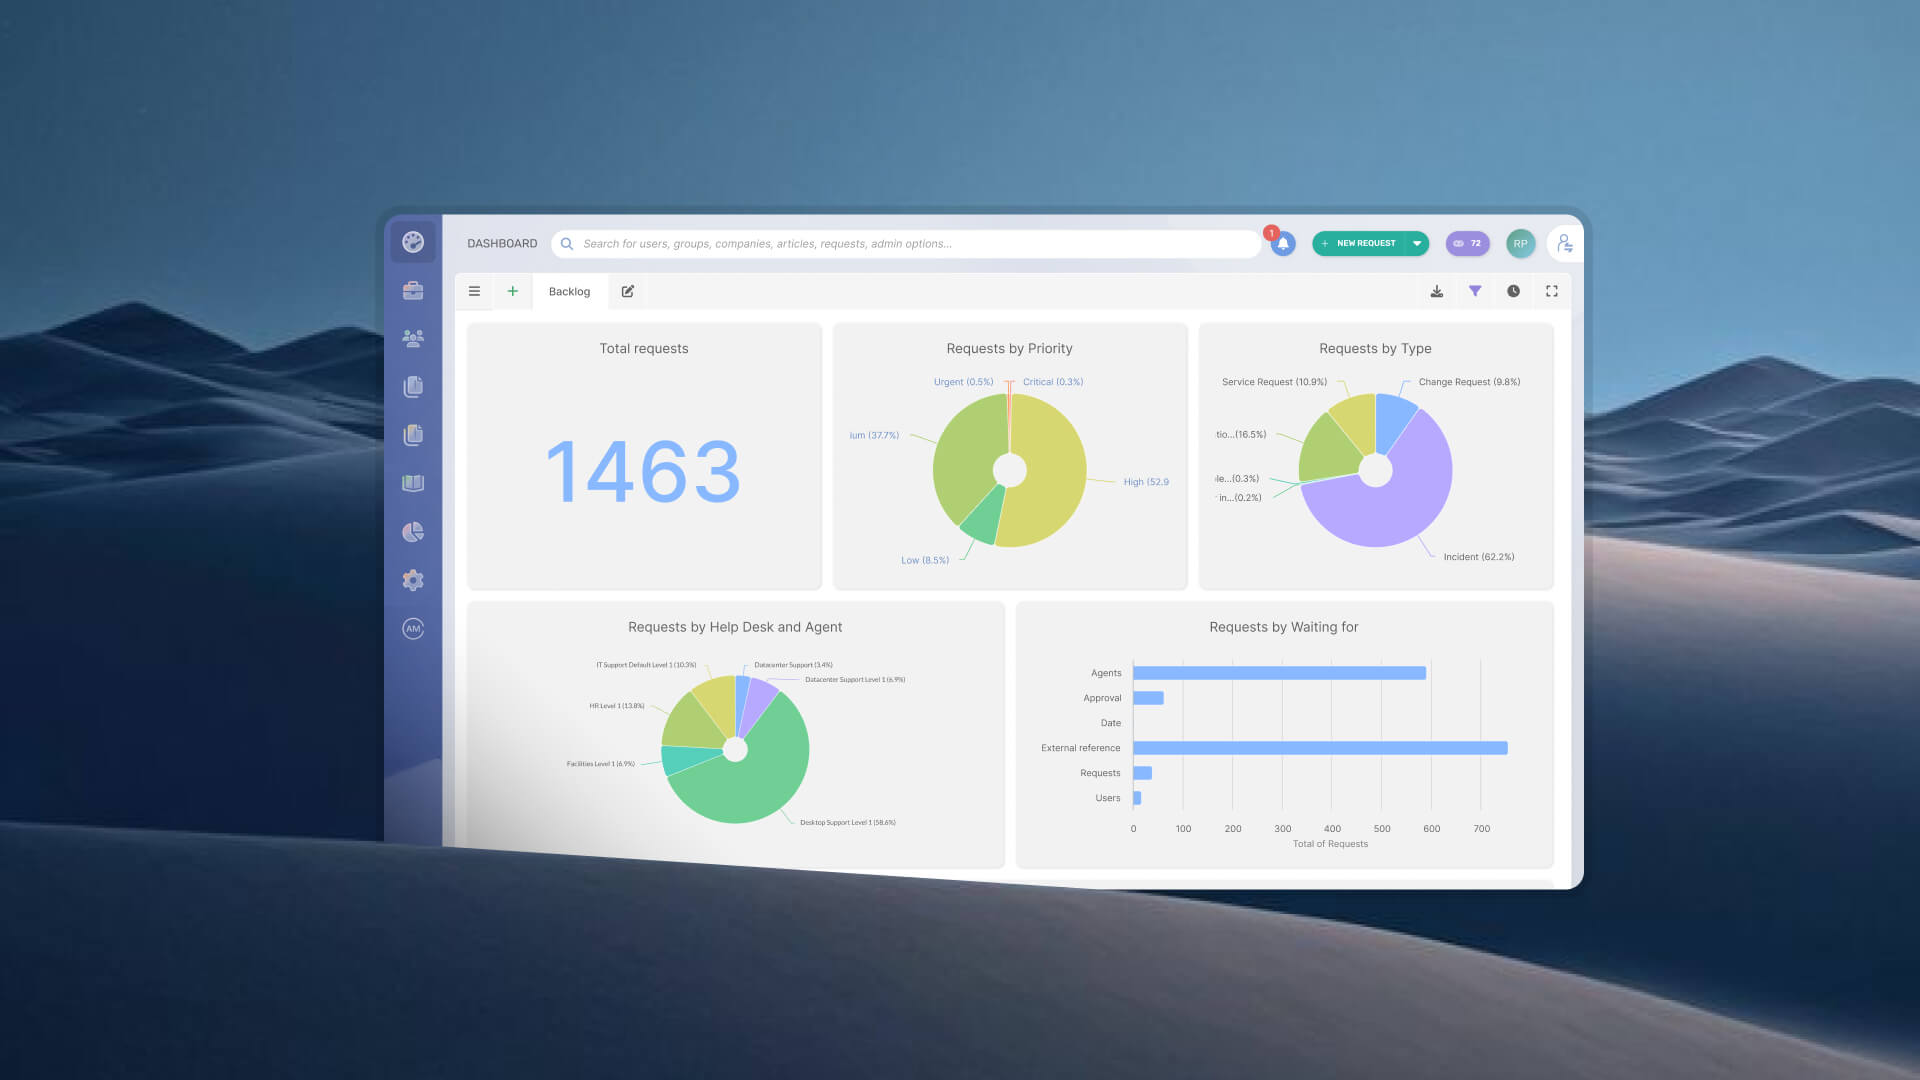
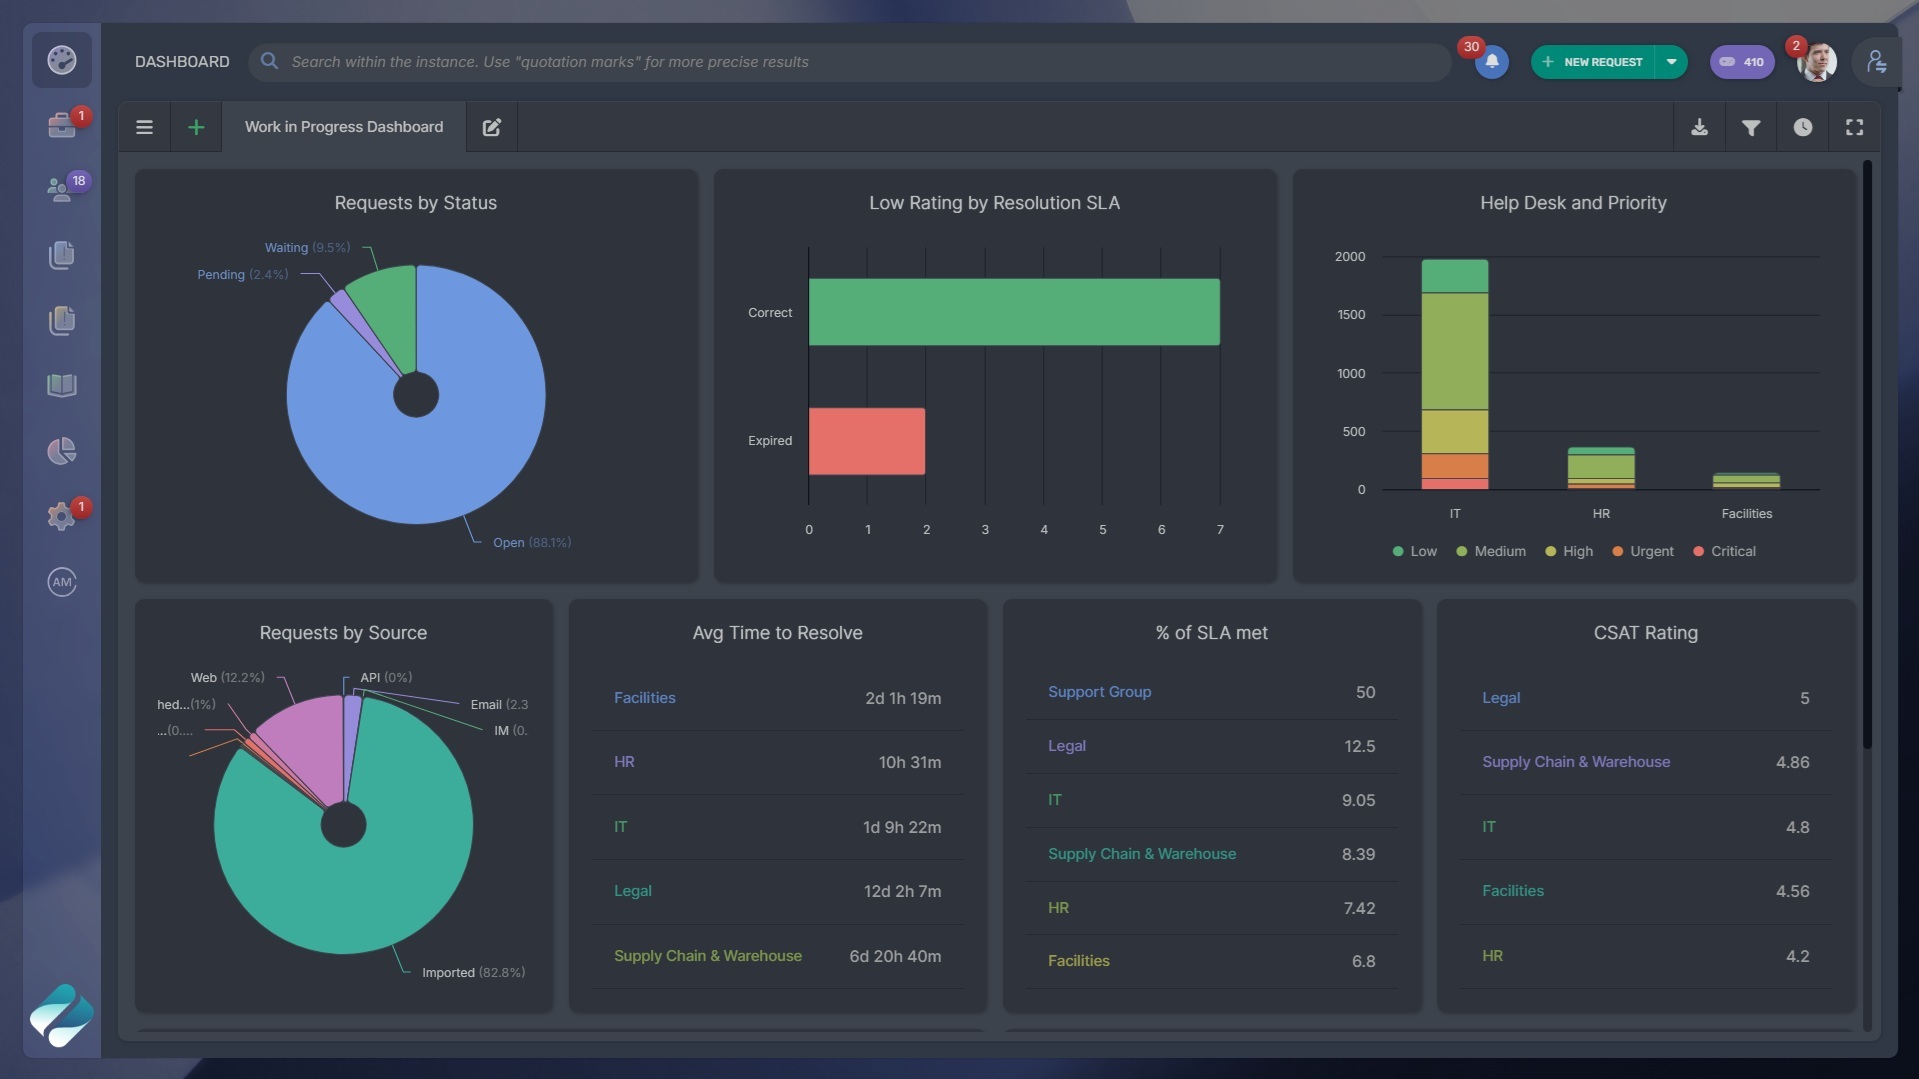
An ITSM dashboard brings these indicators together to give leadership a clear view of service performance, resource constraints, and the trade-offs involved in setting priorities.
The reason to visualize all this isn’t monitoring — it’s leverage. KPIs give IT a way to argue for resources in terms leadership already understands.
At InvGate’s forum for financial-services IT leaders, Kevin Hall, CIO of WESTconsin Credit Union, walked through how he does exactly that. He built a dashboard in InvGate tracking response and resolution times and took it to the board to show what IT was delivering — and where it was running short. His framing puts the expectation and the reality in the same view:
“Here’s the performance you guys are expecting from us. Here’s the level of service we’ve been asked to provide. With the resources we have, we’re struggling.” — Kevin Hall, InvGate Industry Forums - Financial Services IT
The move to copy: don’t ask for headcount in the abstract. Put the service level leadership agreed to next to what the current team can actually sustain, and let the gap make the argument for you.
He’s also deliberate about how the ask is framed:
“It’s not about reducing headcount. It’s about expanding the output of the headcount you have and delivering more.” — Kevin Hall, InvGate Industry Forums - Financial Services IT
The move to copy: present new people or tools as a way to get more out of the team you already fund, not as added cost. That’s the version of the request a finance leader is far more likely to approve.
Most of the service-side KPIs above come straight out of the tool that runs the service desk. InvGate Service Management reporting and analytics turn service desk activity into real-time dashboards and reports built on more than 150 metrics, so response times, resolution times, and SLA compliance can be sliced by agent, team, or department without writing a query.
Satisfaction surveys feed CSAT into the same place, and AI Hub reports show where the Virtual Service Agent is deflecting tickets and how much agents are adopting each AI feature — so the impact of AI on the queue is something you can measure rather than assume.
The payoff shows up in the numbers the teams report. After moving to InvGate, Javer brought its mean time to resolve down from three days to one and now pushes its service metrics to real-time dashboards that leadership can see on demand.
Common ones include first response time, mean time to resolve, first contact resolution, SLA compliance, service uptime, change success rate, cost per ticket, and asset utilization. The right set depends on what your organization needs IT to prove.
Track as many as you need to run the service desk, but report only four to six to leadership. A dashboard with a dozen numbers buries the signal; a handful, each tied to a business question, gets read and acted on.
Start from the questions leadership asks — about responsiveness, reliability, commitments, satisfaction, and cost — and pick the single metric that best answers each. Tie it to the business objective behind the question, confirm your tools already capture the data, and drop anything you can’t act on.
An SLA is the commitment you’ve agreed to — say, resolving urgent tickets within four hours — while a KPI is the measurement that tells you whether you’re hitting it. In fact, SLA compliance is itself a KPI, which is why the two get mixed up.


