


Asset Management dashboards are the best way for technicians and administrators to quickly identify and revise important information. For InvGate Asset Management, this means having a full look at your CIs and their updated status to make well-informed decisions.
At InvGate, we are always looking for ways to address (even more) the specific needs and objectives of our customers. With this in mind, we have been working long and hard to launch two important upgrades:
Let’s take a look at them in more detail and explore how they will help evolve your day to day operations.
Customize Asset Management Dashboards to Monitor IT Assets

New predefined module for Asset Management dashboards
Starting with a significant leap, we have launched new Predefined Dashboards, available for all customers. With InvGate Asset Management v2.0, the default view displayed when you access the feature will showcase an improved user experience and changes to what information is shown and how it is displayed.
We added a new dashboard to the predefined view of the module, “CI status”. Our team selected key indicators and ITAM metrics and incorporated them into new graphics to make them available to users on their homepage.
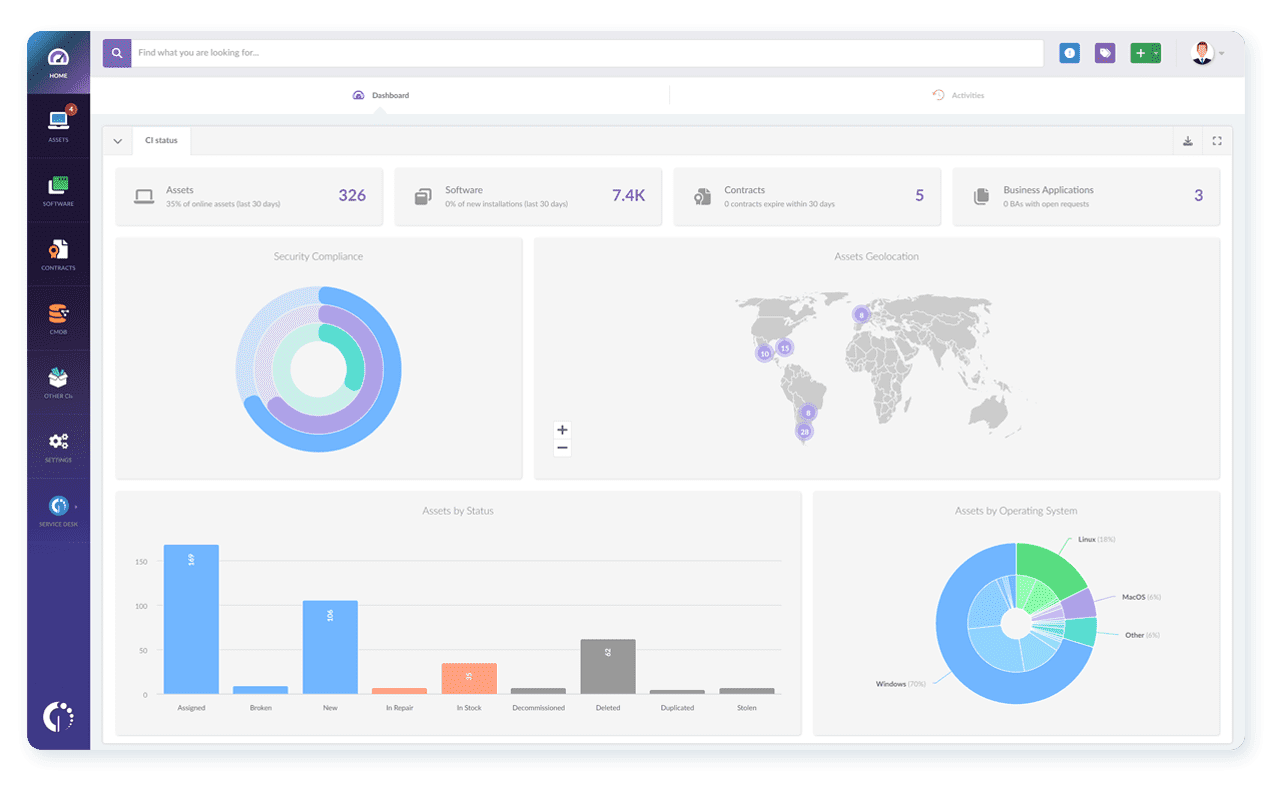
The most important elements you will find under “CI status” are:
- Indicators Panel - This new panel of key indicators displays essential information about IT assets, contracts, software installations, and the CMDB.
- Security Compliance graphic - This graph centralizes the status of encryption, firewalls, and antivirus, showcasing the overall health status of the infrastructure.
- Assets Geolocation graphic - This map presents all the computers with Windows that have been reported on in the last 30 days.
- Assets by Health Status graphic - This chart illustrates the health status of computers according to the criteria defined by the organization.
- Asset Warranty by Manufacturer graphic - This chart displays the distribution of assets by manufacturer, providing a visual representation of warranties that are near their expiration date.
- New Applications Installed graphic - This chart represents the number of software installations reporting for the first time in the instance.
InvGate Asset Management’s Customizable Dashboards
Along with the pre-built dashboards on your home page, and also up from InvGate Asset Management v2.0, we have incorporated Customizable Dashboards. This means users will be able to build them according to your needs, creating personalized views of your ITAM data.
Among the main capabilities of the new feature, you will find:
- Metrics from all the CIs families.
- A wide range of dimensions.
- Custom charts.
- Collaboration between users.
- Reports exported as PDF.
The logic behind this is to show the relationships between a CI group and a dimension. Any queries that you run through the explorer can be turned into a dashboard, and there are no limits for the number of dashboards you can create. Whether it's asset performance, software usage, contract status, or other critical parameters, now you can highlight the indicators and reports that matter most to your organization.
You can then select the graphic that best represents the case's metrics. Each dashboard will contain a set of charts of your choice and you can set its distribution as you prefer, prioritizing your most important charts. You can also see them in full screen to improve your visualization.
In order to facilitate and increase collaboration between technicians, you can share them with other users who will have access to the exact same data, view, and distribution of it. Furthermore, you can export them in PDF to share with external stakeholders.
5 benefits of customizing ITAM dashboards
Here are five of the most significant benefits that customizing your ITAM dashboards will bring to InvGate Asset Management users:
- Tailor the solution to your organization - By highlighting the metrics and reports that matter most, you can make sure your ITAM strategy is aligned with your specific goals and objectives.
- Improve data visibility - You can easily track in real-time the Key Performance Indicators (KPIs) that are most relevant to your organization, and better focus on them.
- Promote better decision-making - With real-time visibility into ITAM metrics, you can identify trends and potential issues, allowing you to make informed decisions that positively impact your organization.
- Increase efficiency - By reducing the time it takes to analyze and act on your ITAM practice, you will increase the overall productivity of your organization.
- Enhance collaboration - Your dashboards can be shared with other team members, encouraging stronger collaboration. This feature enables teams to work together to solve ITAM challenges, as they have a clear and concise view of the data.
Final thoughts
InvGate Asset Management’s new Predefined Dashboard view and Customizable Dashboards will allow you to gain deeper insights into your ITAM data by having quick and easy access to your metrics. These upgrades will help you to improve data visibility, increase efficiency, enhance collaboration, promote better decision-making and tailor views to your organization's needs. Ultimately, it will improve your organization's overall IT Asset Management.
If you have any further questions, contact our support team or your dedicated partner. They’ll attend to all your needs and answer any possible questions.

