Managing incidents effectively is crucial for maintaining service quality and customer satisfaction. But with so many variables at play, how do you keep track of it all? The answer lies in a well-designed Incident Management dashboard. Think of it as your control center, providing real-time insights and helping you make data-driven decisions.
Creating an Incident Management dashboard might sound like a complex task, but it doesn’t have to be. With the right tools and a clear understanding of the essential metrics, you can design a dashboard that not only monitors your incident resolution process but also improves it.
In this post, we’ll walk you through the basics of what an Incident Management dashboard is, the key metrics you should include, and how you can build one using InvGate Service Management.

What is an Incident Management dashboard?
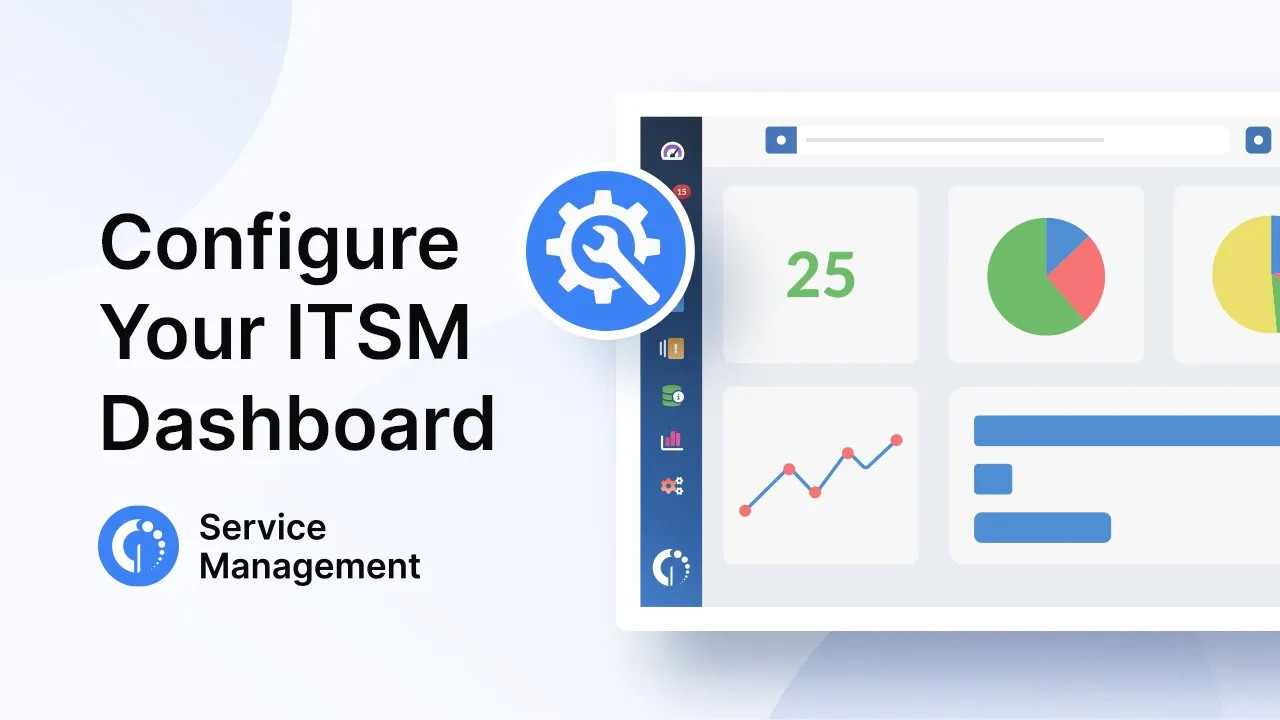
An Incident Management dashboard is a visual tool that consolidates and displays key data related to your Incident Management processes. It offers a real-time snapshot of how your IT team is handling incidents, tracking everything from the number of open incidents to the average resolution time.
This centralized view enables you to quickly identify trends, bottlenecks, and areas for improvement, making it easier to manage resources and prioritize tasks effectively.
A well-designed Incident Management dashboard will highlight critical issues, provide context for the data presented, and help your team focus on what matters most. Whether you’re looking to reduce downtime, improve service quality, or ensure compliance with SLAs, a dashboard tailored to your needs is a game-changer.
Why do you need a dashboard for Incident Management?

Incident Management moves fast. Teams receive a constant flow of tickets, each with its own priority, impact, and urgency. Without a structured way to see what’s happening in real time, it’s easy for information to scatter across tools and people. Managers might rely on static reports or manual updates that quickly become outdated, leaving them blind to rising backlogs or SLA risks. A dashboard changes that by consolidating all relevant metrics — open incidents, resolution times, workloads, and service performance — into a single view that updates automatically.
Incident Management dashboards don’t just provide visibility; they support better decisions at every level. Agents can spot high-priority issues and respond before deadlines are at risk. Managers can see where bottlenecks are forming and allocate resources before delays grow. Executives gain clarity on service reliability and customer impact without asking for manual reports.
Over time, dashboards also reveal patterns — recurring incidents, longer resolution times in certain categories, or rising volumes after specific changes — that feed continual improvement efforts. In short, they connect daily operational work to measurable service outcomes, helping IT teams stay in control even when demand spikes.
Key benefits of using Incident Management metrics dashboards
- Real-time visibility into service health: Dashboards show up-to-date information on open incidents, resolution times, and SLA compliance, helping managers assess workload and performance instantly.
- Faster decision-making: When data is presented visually, teams can identify bottlenecks, recurring issues, or workload imbalances more quickly, leading to faster and better-informed decisions.
- Improved accountability: Metrics linked to specific teams or agents make responsibilities clear. Everyone can see how their work contributes to service goals.
- Easier trend analysis: Historical data presented in graphs or charts helps spot recurring problems or patterns over time, supporting proactive Incident Management efforts.
- Better communication with stakeholders: Dashboards make it easier to present progress, SLA adherence, and improvement areas to management or clients without manually compiling reports.
- Clear progress tracking toward goals: Visual indicators like charts or deviation graphs show how performance compares with targets, helping teams monitor progress and make timely adjustments.
Relevant metrics to include in Incident Management dashboards
Metrics are the backbone of any Incident Management dashboard, providing the data you need to monitor performance and make informed decisions. To get the most out of your dashboard, it’s important to include a mix of both ticket-based and time-based metrics:
Ticket-based metrics focus on the details of individual incidents, providing insight into how each ticket is being processed. These metrics are essential for understanding the workload of your IT team and ensuring that incidents are being handled appropriately.
Time-based metrics, on the other hand, involve tracking how long it takes to handle incidents, often using time tracking software. These metrics are crucial for assessing the efficiency of your Incident Management processes.
Combined, they ensure you have a comprehensive view of how well your Incident Management processes function. Here are some of the most important metrics to consider including in your Incident Management dashboard:
- Number of Open Incidents (ticket-based): The total number of incidents that are currently open and unresolved. It’s crucial for understanding your IT team's workload and identifying potential bottlenecks in the resolution process.
- First Contact Resolution Rate (ticket-based): This metric measures the percentage of incidents that are resolved during the first interaction with the IT team. A high FCR rate indicates that your team is well-prepared and capable of handling incidents efficiently.
- Average Resolution Time (time-based): Tracks the average time it takes to resolve an incident from the moment it is reported until it is closed. This metric is vital for assessing the efficiency of your Incident Management process and ensuring prompt issue resolution.
- Incident Response Time (time-based): It measures the time taken for the IT team to respond to an incident after it has been reported. Monitoring this metric helps you evaluate how quickly your team can address new issues, which is essential for minimizing downtime.
-
SLA Compliance Rate (time-based): This metric tracks the percentage of incidents resolved within the timeframe specified by your Service Level Agreements (SLAs). It is crucial for ensuring that your team meets its contractual obligations and maintains a high standard of service.

How to create an Incident Management dashboard

Building an effective incident management dashboard starts with understanding what information your team needs to make timely, informed decisions. The goal is not just to visualize data, but to make it actionable — helping you spot trends, identify risks, and allocate resources effectively. Here’s a step-by-step approach:
-
Define your audience and purpose.
Identify who will use the dashboard — agents, managers, or executives — and what questions it should answer. For example, agents may need visibility into pending incidents, while managers might focus on SLA compliance or team workload. -
Select key metrics to track.
Focus on metrics that reflect performance and service health, such as:- Number of open incidents (by priority or service)
- Mean time to resolution (MTTR)
- Time to first response
- SLA compliance rate
- Incident recurrence and reopen rate
- Customer satisfaction (CSAT) scores
-
Organize your data sources.
Pull data directly from your ticketing or ITSM system to avoid manual updates. Make sure your fields — such as priority, category, and assignment group — are consistent across records so the dashboard reflects accurate information. -
Design the layout around clarity.
Group visuals by theme. A good option is: workload indicators at the top, performance trends in the middle, and historical analysis at the bottom. Use filters for date ranges, priority levels, or services to make exploration simple. -
Add real-time and historical views.
Combine live metrics (open incidents, SLA breaches) with historical trends (MTTR over time) to understand both what’s happening now and how performance evolves. -
Set up alerts and thresholds.
Add indicators that highlight SLA risks or sudden spikes in ticket volume. A dashboard should not only display data but also help teams act before service quality declines. -
Review and adjust periodically.
Treat your dashboard as a living resource. Reassess which metrics are most useful, adjust thresholds, and refine visualizations as the team’s needs evolve.
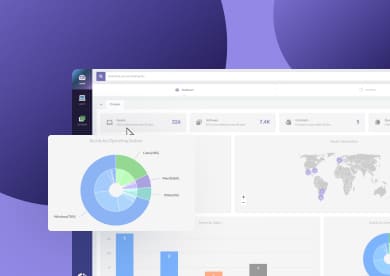
With InvGate Service Management, you can build this type of dashboard directly within the platform. Within the dashboard section, you can choose to track all key incident metrics, visualize trends, and create tailored views for each role — from frontline agents to senior management. You can customize widgets, automate report delivery, and use built-in filters to drill down by service, category, or team, ensuring that everyone sees the data most relevant to their work.
5 Incident Management dashboard examples
Creating a useful dashboard depends on what you want to track and who will use it. Here are a few examples of configurations that support different needs within the Incident Management process:
-
Operations overview dashboard: Shows open incidents by priority, service, and team to monitor workload in real time. Ideal for daily stand-ups or shift handovers.
-
SLA performance dashboard: Tracks compliance rates, time to first response, and average resolution time to identify trends and risks before breaches occur.
-
Major incident dashboard: Focuses on ongoing high-impact issues with metrics like time since detection, affected services, and communication updates to coordinate response.
-
Service reliability dashboard: Combines incident frequency and MTTR data by service or configuration item (CI) to reveal recurring problems and support root cause analysis.
-
Customer experience dashboard: Highlights CSAT scores, reopened incidents, and average handling times to assess user satisfaction and improve service delivery.
Using InvGate Service Management as your Incident Management software
InvGate Service Management simplifies how you monitor and improve your incident process. Its dashboard and reporting features give you real-time insight into ticket volumes, SLA performance, and team workload, all in one place. You can customize widgets to track key metrics, set visual indicators for SLA risks, and automatically share reports with managers or stakeholders.
The platform also supports visibility rules, allowing you to define who can access specific data or dashboard views. For instance, agents can focus on their assigned tickets and performance, while managers get a broader overview of service health across teams. This keeps information secure and relevant to each role without cluttering the interface.
If you're interested in experiencing InvGate Service Management firsthand, you have two options: either request a 30-day free trial or arrange a call with our team, who will guide you through the tool’s certified practices.


