


Do you need Change Management KPIs? Carrying out a change is one thing; knowing if it worked as intended is another. The right KPIs will show if your efforts are effective, if users are adopting the change, and if the business is actually seeing a benefit.
Still, no single number tells you everything when measuring Change Management, and some of the most useful indicators require more than tracking system logs. But with the right structure, it’s possible to build a clear picture of how well your Change Management process is performing.
This article walks you through the key performance indicators (KPIs) that matter, how to apply them, and what to watch for.
Let’s break it down step by step.
8 Change Management KPIs and metrics for success
There’s no one-size-fits-all dashboard for change success. What matters will vary depending on your organization's size, maturity level, and change strategy. Still, the KPIs below offer a solid starting point.
1. Percentage of successful changes
This metric tracks the number of changes that were implemented without causing incidents, disruptions, or needing rollback. A consistently high success rate signals a mature change management process. On the other hand, if success is only happening after emergency interventions or rework, the number loses value.
Suppose you're regularly seeing failed or partially successful changes. In that case, it's worth reviewing whether change requests include clear documentation, if the risk assessment is realistic, or if approval workflows are being followed.
Here, you should look for consistency over time and improvement following reviews or process adjustments.
2. Change failure rate
On the flip side, you can also measure changes that led to negative outcomes — incidents, degraded performance, or emergency rollbacks. A rising failure rate may indicate rushed approvals, poor implementation planning, or inconsistent post-implementation reviews.
You can use this KPI to identify the types of changes that fail most often, which teams are requesting or implementing them, and whether change templates or knowledge base articles are being reused correctly.
Tip: Break this down by change type: standard, normal, or emergency. That way, you can see if specific change categories need more review or testing.

Recommended reading
Read Article
Change Request: Definition, Form, And Free Workflow Template
3. Average time to implement changes
This metric tracks how long it takes to implement a change from the moment it's approved.
If changes consistently take too long, the cause might be bottlenecks in Change Advisory Board (CAB) meetings, unclear risk classifications, or overdependence on manual handoffs.
Conversely, too-quick implementations — especially for non-standard changes — can be a red flag for skipped steps.
4. Percentage of emergency changes
Emergency changes are sometimes necessary, but frequent use can indicate a reactive culture or poor planning. Tracking their proportion helps spot trends before they affect long-term stability.
Why should you measure this? Because a high percentage might show that standard and normal changes aren’t being identified or submitted early enough.

Recommended reading
Read Article
A Deep Dive Into the Emergency Change Control Process
5. Number of changes by type and category
Segmenting changes by type (standard, normal, emergency) and category (e.g., infrastructure, application, security) helps uncover patterns in how your team handles change.
For example, if emergency changes make up a large share of total changes, that could point to more than just poor planning. It might reflect gaps in risk assessments, ineffective testing environments, or a lack of engagement from stakeholders during the change advisory process.
Similarly, if security-related changes are consistently marked as urgent, it may be time to review how vulnerabilities are reported and addressed. Tracking this over time lets you compare how different teams or departments manage risk, and whether change requesters are aligning with governance expectations.
You can also use this data to spot overuse of the “normal” category when a change might be better structured as standard and automated. That kind of insight can guide training or process improvements.
6. Change backlog
Unapproved or pending changes can build up and delay business improvements. A growing list of pending changes often signals process inefficiency. Maybe approvals are taking too long, maybe the CAB is overloaded, or maybe teams are delaying implementation due to lack of capacity or unclear requirements.
Tracking this number regularly helps prevent a buildup that can reduce agility and frustrate stakeholders. It's also a useful early warning sign if the rate of submitted changes is outpacing completion.
This is especially helpful for managers looking to balance incoming change requests with existing team capacity.
7. Number of escalations and reassignments
If changes frequently require escalation or get passed around between teams, there may be underlying issues with classification, ownership, or skill alignment.
These related metrics are especially useful when tracked together:
- Number of escalations on change-related requests.
- Number of reassignments after a change request is opened.
- Number of category changes after initial classification.
- Priority changes made throughout the lifecycle.
8. Number of changes rejected or withdrawn
Rejected or withdrawn change requests don’t just represent wasted effort — they can point to unclear requirements, poor communication, or misalignment between teams and approvers.
If you're seeing a high volume in this area, it could be time to review how well the change request process is documented, how often stakeholders are involved from the start, and whether your forms and change workflows support accurate submissions.
Recommended reading
Read Article
How to Build a Change Management Workflow
Tips to measure Change Management performance success
Even the most carefully chosen KPIs won’t give you much unless they’re tracked consistently and interpreted in context. Here are some general recommendations to support meaningful performance measurement:
- Stick to a defined change model. Whether you follow ITIL or an internal structure, consistent classification helps avoid confusion when analyzing KPIs.
- Track KPIs over time. One-off snapshots can be misleading. Look at trends and use them to adjust your process gradually.
- Don’t only rely on technical metrics. Operational metrics (like success rate) need to be balanced with user-facing ones (like satisfaction).
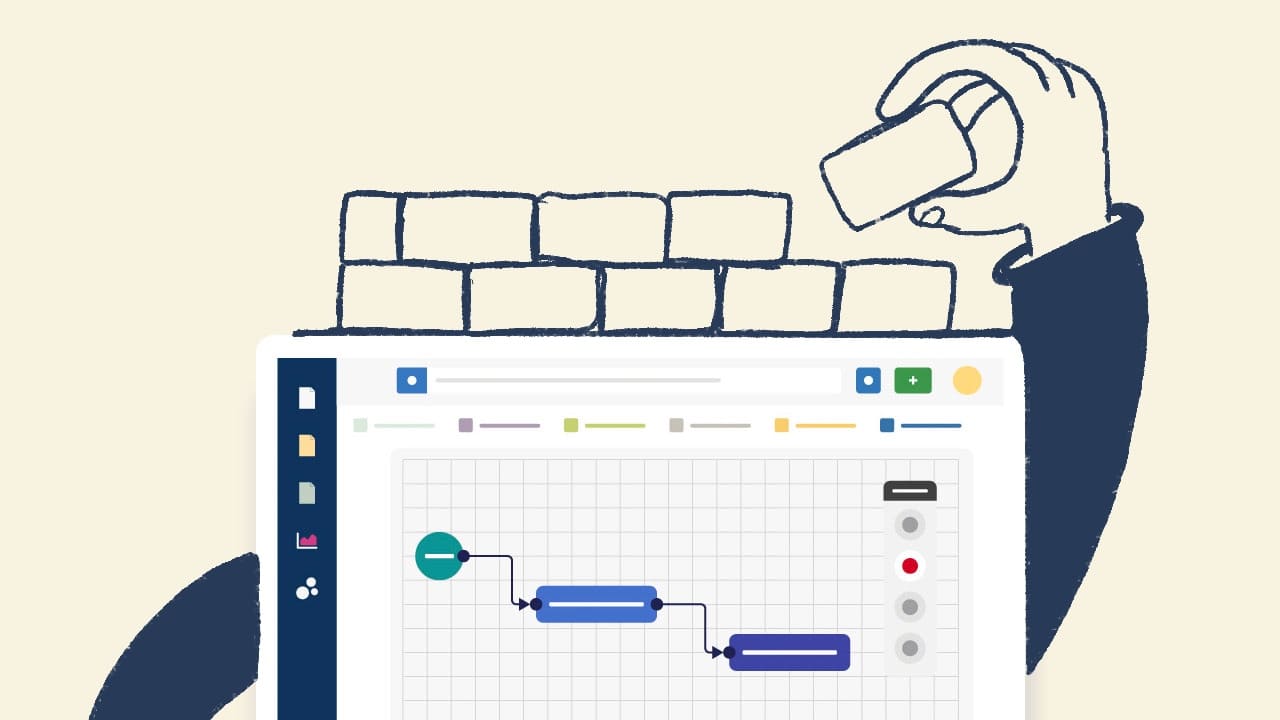
- Use dashboards to bring clarity. Tools like InvGate Service Management offer visual dashboards that pull data from your change logs and service desk in one place. These dashboards help detect deviations between expected and actual performance.
- Review with stakeholders. Share performance metrics with both IT and business stakeholders during regular reviews. KPIs are more actionable when they’re part of a shared conversation.
In short
Change Management KPIs help you understand whether your process is doing what it’s supposed to. They support business goals while minimizing risk and disruption, and help support better decisions and smarter prioritization.
There’s no perfect set of metrics, but a thoughtful combination of implementation data, service desk indicators, and user feedback gives you a reliable picture. With the right tools and a consistent review rhythm, measuring Change Management becomes more than a checkbox — it becomes a strategic advantage.

