There are many metrics you can track in ITSM, but the ones below represent the core indicators most teams use to monitor the health and performance of their Incident Management practice.
Incident Management metrics help IT teams measure how effectively they detect, respond to, and resolve service disruptions. These numbers bring operational visibility, and they show whether your processes actually support quick recovery and minimal business impact.
When used well, metrics turn day-to-day incident data into a feedback loop for improvement. They highlight where time is lost, which issues recur, and how users perceive support.
However, the challenge isn’t just collecting data, but knowing which indicators are meaningful for your context. That's why, in this guide, you’ll find key ITSM metrics used in ITIL’s Incident Management practice, including their definitions, formulas, and what each one reveals. You’ll also learn how to set realistic targets, build a metrics dashboard, and improve results through better processes and tools.
What are Incident Management metrics, and why do they matter
Incident Management metrics measure how effectively your IT team detects, responds to, and resolves service disruptions. According to ITIL, the goal of the practice is to restore normal service operation as quickly as possible and reduce the impact on users and business operations.
A balanced metrics set should reflect:
- Speed: How fast your team reacts and resolves (MTTA, FRT, MTTR).
- Quality: How well they solve problems on the first try and satisfy users (FCR, CSAT).
- Control and reliability: How stable and predictable your process is (SLA compliance, backlog, escalation rate, reopen rate, incident volume, MTBI).
You don’t need to track every available metric to get value from measurement. Start with a few core indicators that align with your current goals and maturity level—for instance, MTTR and SLA compliance for performance, or FCR and CSAT for service quality. Once those are stable, expand gradually.
It’s also worth assigning clear ownership for data collection and review. Someone in the team should be responsible for monitoring trends, identifying anomalies, and translating numbers into action. Metrics are most useful when they guide decisions — such as adjusting staffing, refining workflows, or improving communication — rather than just filling dashboards with data.
Core metrics and formulas
MTTA – Mean Time to Acknowledge
MTTA shows how long it takes for your team to acknowledge an alert or incident after it’s reported. It’s often the first indicator of responsiveness, especially in high-impact environments where every minute counts. Tracking MTTA helps you identify delays in monitoring tools, notification systems, or team availability.
To calculate it, you’ll need the alert or ticket creation time and the moment it’s first acknowledged by an agent or automated system.
Formula: (Sum of acknowledgment times − alert times) ÷ number of incidents
FRT – First Response Time
First response time measures the average time between a user submitting a ticket and receiving the first agent reply. It’s a strong signal of communication quality and helps gauge user perception of support efficiency. A fast response — even before resolution — can reassure users that the issue is being handled.
Formula: First agent response − ticket creation
MTTR – Mean Time to Resolve
MTTR tracks how long it takes, on average, to fully resolve incidents once they’re reported. It reflects the efficiency and effectiveness of your resolution process. Consistently high MTTR may point to process gaps, unclear ownership, or complex recurring problems.
Formula: Total resolution time ÷ number of incidents
What is a good MTTR for IT incidents?
Keeping MTTR low depends on automation, clear escalation paths, and accurate incident categorization. Many mature IT teams aim for continuous improvement rather than a fixed target.
A “good” MTTR also depends on your environment and service type. For most IT teams, keeping average resolution time under four business hours for standard incidents is considered efficient, but major or infrastructure-level issues can take longer.
Is MTTR the same as Time to Resolve?
They’re related but not identical. MTTR is an average across multiple incidents, while Time to Resolve refers to how long a specific incident took to close.
FCR – First Contact Resolution
First Contact Resolution (FCR) indicates the percentage of incidents solved during the initial contact without escalation or reopening. It’s one of the best indicators of both agent skill and process clarity. Higher FCR often correlates with higher customer satisfaction and reduced workload for higher-tier support.
Formula: (Tickets resolved on first contact ÷ total tickets) × 100
SLA compliance
SLA compliance measures how often your team resolves tickets within the timeframes defined in your service level agreements. It shows whether your operations meet agreed expectations and helps flag service areas that need improvement.
Formula: (Tickets resolved within SLA ÷ total applicable tickets) × 100
Incident backlog
Incident backlog shows how many open tickets remain unresolved at the end of a given period. It’s useful to evaluate workload balance, staffing levels, and the overall efficiency of the Incident Management process. A growing backlog signals that demand is outpacing capacity.
Formula: Number of open incidents at period end
Escalation rate
Escalation rate measures how often incidents require involvement from a higher support tier. Frequent escalations can indicate skill gaps at the first level, unclear knowledge documentation, or overly complex categorization. Monitoring it helps identify training needs and improve self-sufficiency in first-line support.
Formula: (Escalated incidents ÷ total incidents) × 100
Reopen rate
Reopen rate reflects how often resolved tickets are reopened by users or the support team. A high rate may indicate premature closure, misdiagnosis, or incomplete fixes. It’s a good metric for assessing service quality and root cause analysis effectiveness.
Formula: (Reopened incidents ÷ closed incidents) × 100
Incident volume by priority
Incident volume by priority breaks down the total number of incidents by their assigned priority (for example, P1–P5). It helps you spot trends in service health — like recurring P1 incidents or an excess of low-priority requests — and supports resource allocation.
Formula: Count of incidents by P1–P5 (or local scale)
CSAT – Customer Satisfaction
CSAT captures how satisfied users are with the support they received, usually through short surveys after ticket closure. It’s a direct indicator of perceived service quality and agent communication. Tracking CSAT over time can help assess whether process changes are improving user experience.
Formula: (Positive survey responses ÷ total responses) × 100
How to set targets and build an incident metrics dashboard
Once you’ve identified which metrics matter most to your team, the next step is turning them into actionable insights. Start by segmenting your data. Track metrics by priority, service, support channel, and business hours. That segmentation helps you distinguish between chronic issues in specific areas and isolated anomalies. For example, a spike in MTTR during off-hours might point to staffing constraints rather than process inefficiency.
Before defining targets, establish a baseline. Review historical data to understand your current performance levels, then set targets tied to your SLAs (Service Level Agreements) and SLOs (Service Level Objectives). A baseline ensures goals are realistic and meaningful — otherwise, you risk creating numbers that look good on paper but don’t reflect service realities.
Decide on a reporting cadence that fits your team’s rhythm. Weekly or biweekly reviews work well for operational tracking, while monthly summaries can feed into broader performance reports.
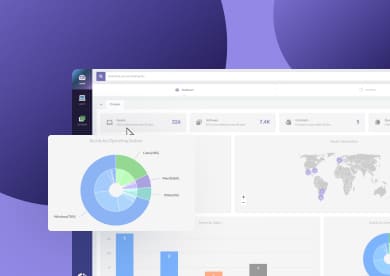
When designing your dashboard, focus on visual clarity rather than volume. Effective visualizations include:
- Time-to-X trend lines (MTTA, MTTR, FRT) to show progress over time.
- SLA compliance heatmaps highlighting services or teams that frequently miss targets.
- Backlog aging charts to show how long tickets stay unresolved.
- Escalation funnels to visualize how incidents move between support tiers.
A few common mistakes are worth avoiding when tracking incident metrics:
- Averaging results across all priorities: Mixing P1 (major) and P4 (minor) incidents into one average can make performance look better than it is.
→ Better approach: Track and report metrics separately by priority level. For example, a 30-minute MTTR for P4s doesn’t mean much if P1s are taking six hours. - Ignoring major incidents: Excluding large-scale outages from reports might keep your averages low, but it hides the issues that matter most to the business.
→ Better approach: Include major incidents in trend analysis and review them separately with post-incident reports to identify systemic improvements. - Measuring without taking action: Collecting data just to fill dashboards doesn’t help if no one uses it to make changes.
→ Better approach: Assign ownership for each key metric and discuss trends in regular review meetings. For instance, if FCR drops, investigate whether new ticket categories or training gaps are affecting resolution rates.
Improving incident KPIs with better processes and tools
Improving performance isn’t just about tracking the right numbers—it’s about understanding what drives them. Each metric connects to a specific part of your Incident Management process, and each practice you strengthen will reflect in specific KPIs.
- Refine triage and routing: Direct incidents to the right person or team from the start. Clear categorization rules, automated ticket assignment, and predefined urgency levels reduce time wasted in transfers. → Improves: MTTA and FRT.
- Use automation for repetitive tasks: Automate notifications, status updates, and routine actions such as ticket assignment or prioritization. That frees agents to focus on analysis and resolution instead of manual steps. → Improves: MTTA and MTTR.
- Adopt templates and standard responses: Create templates for common incident types and communication steps (acknowledgment, resolution, escalation). They cut response time and ensure consistency in updates. → Improves: FRT and SLA compliance.
- Strengthen your knowledge base: Maintain clear, updated articles linked to known problems. It helps agents solve issues on the first contact and reduces dependency on higher-tier support. → Improves: FCR and Reopen Rate.
- Link incidents to problem records: Associating recurring incidents with their root problems provides visibility into underlying causes and long-term fixes. → Improves: MTTR and incident volume trends.
- Review and groom the backlog regularly: Periodically review unresolved tickets to close outdated ones and reprioritize active work. This prevents queues from becoming unmanageable. → Improves: Backlog size and SLA compliance.
The key is to treat metrics as signals, not scores. When you see trends (like a rising escalation rate or high reopen ratio), look for what’s causing them and adjust processes accordingly. Over time, this feedback loop turns raw data into practical improvements across the Incident Management lifecycle.
If you want to see how automation, workflows, and dashboards can help apply these practices in one place, InvGate Service Management is a complete solution, and you can explore it firsthand — sign up for a 30-day free trial!


.jpg?upsize=true&upscale=true&width=780&height=205&name=how-to-create-a-service-level-agreement%20(1).jpg)
