


The Software Metering feature in InvGate Asset Management lets you monitor how applications are actually used across the different devices in your IT ecosystem.
The benefits are clear. At an organizational level, Software Metering helps reduce costs, strengthen compliance, and optimize software investments across the entire company. At an operational level, it gives IT teams the clarity they need to manage applications more efficiently and plan future purchases with confidence.
In the following sections, we’ll define what Software Metering is, how it works in InvGate Asset Management, what data it provides, and its most common use cases.
What exactly is software metering?
Software Metering is the process of collecting real usage data from applications installed across an organization’s IT environment. It tracks which software is installed on each device, who uses it, how often it’s launched, how long it’s actively used, and when it was last accessed.
This usage data is gathered directly from endpoints and provides an objective view of application adoption. On its own, Software Metering answers one core question: what is actually being used. When combined with contract and license information, it becomes the foundation for software compliance, license optimization, and informed purchasing decisions.
How does software metering work?
Software Metering is a standard capability in IT Asset Management platforms. It works by collecting application usage data directly from endpoints, usually through an agent installed on each device. This agent continuously monitors software activity and sends usage information back to the central platform, creating a reliable view of how applications are being used across the organization.
In InvGate Asset Management, this process is powered by a lightweight agent deployed on your devices. The agent reports usage data every five minutes, turning Software Metering into an information layer.
Setting up Software Metering in InvGate Asset Management
Before diving into usage insights and optimization scenarios, it’s important to make sure Software Metering is properly configured. Complete the following steps before moving on:
- Install the InvGate Asset Management Agent on your devices - The agent collects application usage data and reports it back to the platform every five minutes, providing visibility across your environment.
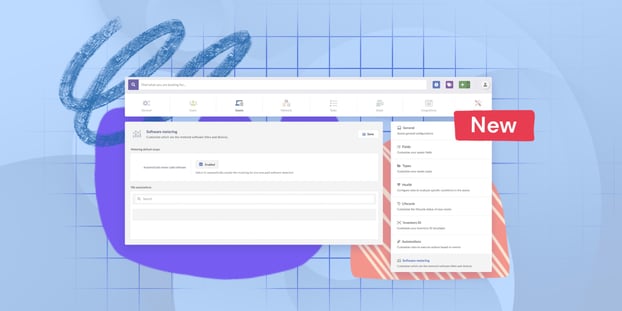
- Enable software metering in InvGate Asset Management - Go to Settings > CIs > Software metering and confirm that the toggle is switched on.
Visualizing software metering data in InvGate Asset Management
The information collected by InvGate Asset Management’s Software Metering feature is reflected in different areas across the platform, since it becomes part of each software asset’s data. That said, here are three common scenarios where you can view and analyze the information gathered by the agent:
- Software Explorer – Lets you search and filter installed software across your IT environment.
- Software Profile – Provides quick access to usage metrics and key details for each specific application.
- Software Compliance module – Displays software usage metrics and adds compliance-related insights based on the contracts each application is associated with.
#1: Software Explorer
 This is the easiest way to view the data collected by the Software Metering feature. From the Software section, you can configure which columns to display and filter applications based on usage-related metrics.
To get started:
- Go to Software.
- Click the “Options” button on the far right of the screen.
- Select “Table columns” and choose the fields that best match your analysis needs.
Some of the most relevant metering-related columns include:
- Last use – Shows when the application was last used on each asset. You can hover over the relative date to see the exact date and time.
- Installation metered – Indicates whether the installation is actively being metered on that device, depending on both software and asset configuration.
- Used last 7 days – Displays the accumulated usage time of the application over the last 7 days, along with a usage trend indicator (green for increased usage, red for decreased usage). Additional columns can be enabled for the last 15, 30, or 60 days.
Note: You can create a “New view” from the Explorer and use filters to run targeted searches. These views will surface valuable insights about software usage. You can also use AI Smart Search in the search bar to find what you’re looking for faster.
#2: Software Profile

Another way to view Software Metering data is directly within each software profile. Simply click any software in the Software Explorer. By default, you’ll see two key indicators:
- Software usage on the device over the last 7 days.
- Historical software usage on the device.
To extend the visual analysis of this data, we recommend creating a custom Software dashboard. This allows you to build as many charts as your strategy requires to more closely monitor software usage across your IT environment.
#3: Software Compliance module
 Finally, one of the most powerful applications of Software Metering insights is software licensing and Contract Management.
By navigating to the Software Compliance section, you can combine real usage data collected by Software Metering with contract information, including license entitlements. This gives you a clear picture of how your organization’s actual software consumption compares to what you’ve purchased.
From this module, you can quickly identify:
- Applications that are overused compared to available licenses.
- Software that is underutilized or inactive, creating opportunities for license reharvesting.
- Compliance risks caused by license shortages or untracked installations.
- The relationship between installations, active users, and contract entitlements, all in one place.
Because Software Compliance connects metering data with contracts, InvGate Asset Management lets you move beyond simple inventory tracking. You can detect unused licenses, prevent over-licensing, reduce compliance risk, and make purchasing decisions based on real usage rather than estimates.
In short, Software Metering provides the usage layer, contracts define your entitlements, and the Software Compliance module brings everything together to support optimization, cost control, and compliance.
Note: If you’d like to learn more about what our Software Compliance module can do, you can read this article for a deeper look at its capabilities.
Conclusion
Software metering turns raw usage data into actionable insights. By showing how applications are actually used across your IT environment, it gives organizations the visibility they need to optimize software investments, strengthen compliance, and eliminate waste.
With InvGate Asset Management, software metering goes beyond simple tracking. Combined with Contracts and the Software Compliance module, it enables IT teams to identify unused licenses, prevent over-licensing, and make informed decisions based on real usage. The result is a more efficient, compliant, and cost-effective approach to managing software across the entire organization.
If you’d like to see software metering in action, start a 30-day free trial of InvGate Asset Management or reach out to our sales team to explore how usage data can support your Software Asset Management strategy.

