For as much as everyone in IT knew about the importance of experience in previous years, 2021 really felt like the year where the true importance of it finally rose to the awareness of people working in all sectors of Enterprise IT. Companies are implementing Experience Level Agreements (XLAs) at a faster pace, and 85% of organizations also self-report understanding the need to deliver a better employee experience, according to a study by AXELOS and itsm.tools.
User experience is at the top of everyone’s mind, and rightfully so. The emphasis on experience-driven IT services is more than a passing hype, but an inflection point in the industry’s understanding of what it means to prioritize experience in IT service management (ITSM).
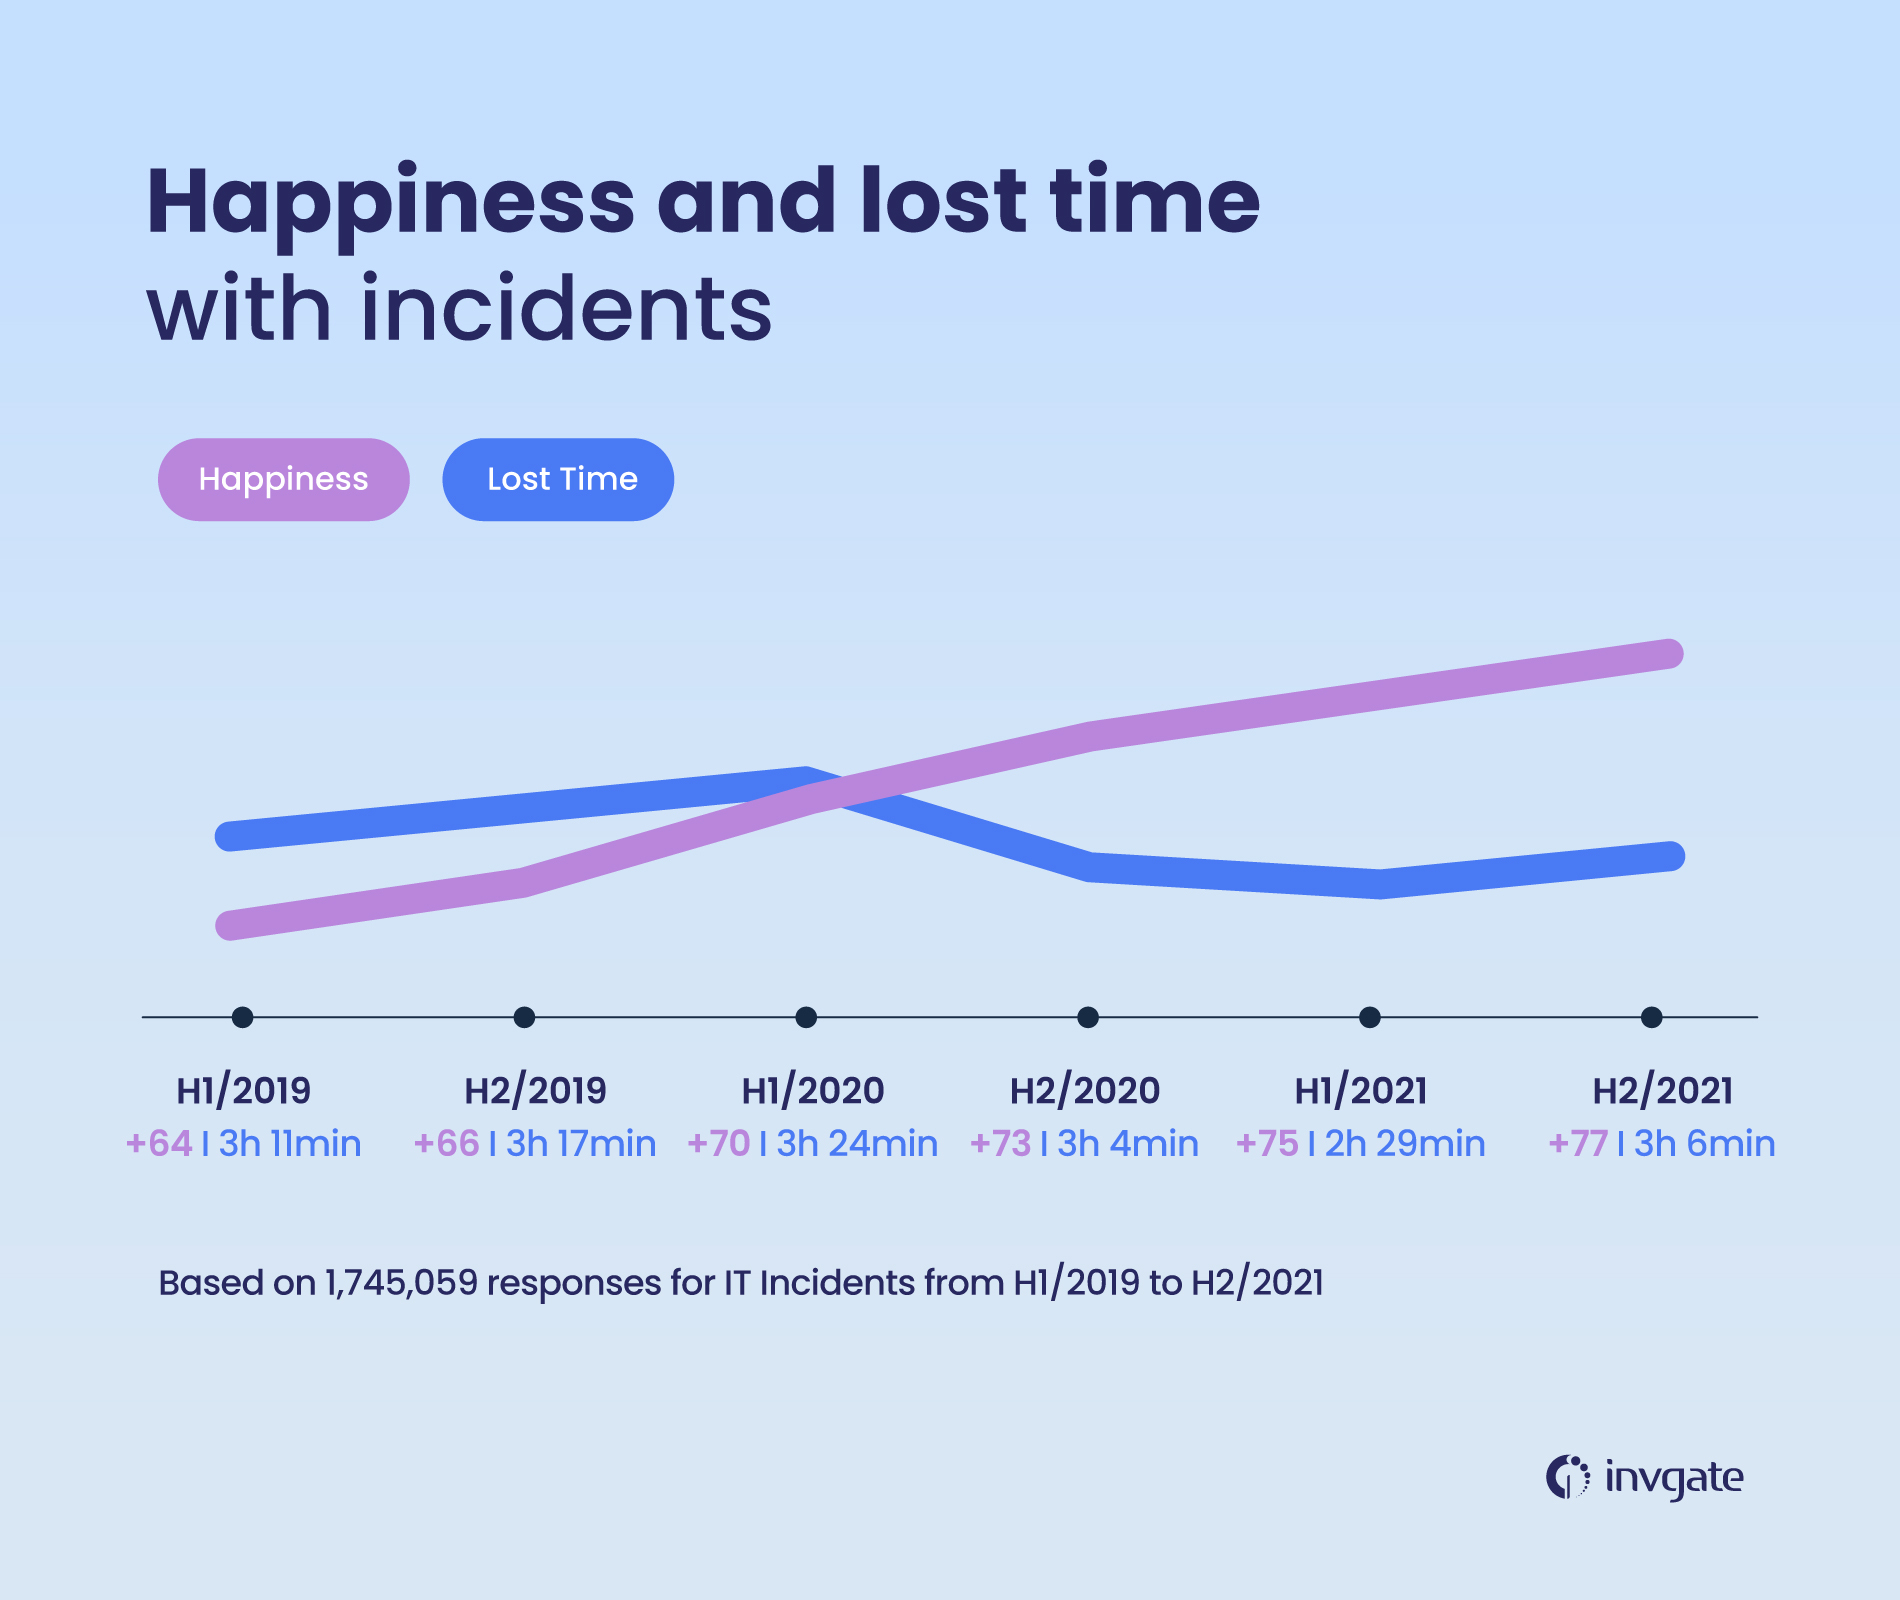
And since experience should be human-centric, it's crucial to measure the happiness of end-users to understand if we're on the right path. Luckily, HappySignals did just that and released a customer experience benchmarking report fueled by data of almost 750K end-user responses from July to December 2021.
Before we dive into the details, it's safe to say that the main conclusion - from our point of view - is that service portals are no longer the least liked IT touchpoint! Furthermore, for the first time in three years, employees are losing less time per ticket when using them than email as a channel for IT support services.
That being said, it's time to take a more comprehensive look at the results.
What is the Happy Signals Global IT Benchmark Report?
HappySignals is a company that focuses on helping businesses improve their internal services by shifting the focus away from traditional metrics and instead emphasizing employee happiness, productivity, and overall experience.
Between July and December of 2021, HappySignals collected 748,878 end-user responses through their Experience Management platform. These responses come from IT end-users (employees), capturing their feelings and perceptions on their experience, painting a comprehensive picture of industry trends.
The report centers around these metrics:
- Happiness (How happy end-users are with the IT area being measured)
- Productivity (How much work time they lost due to the IT area being measured)
- Factors (A list of suggested reasons that influenced end-users’ Happiness rating)
Once again, it’s important to recall that HappySignals is reporting specifically on their customers; although there’s a lot that can be applied to the broader IT landscape, this is all coming from companies that are already working hard on improving their IT experience. Keep this in mind as you browse its findings.
Since this measures companies that are being proactive about the experience improvement, it means the results will trend more positive than organizations that haven’t yet implemented experience management strategies.
Key findings from the customer experience benchmarking report
There’s a lot to dig into in this report. Let’s take a look at three key findings that are of special relevance to the world of ITSM; if you want to read the entire report, click here
Continuous experience measurement has boosted the Service Portals happiness score, but there is still work to be done
Between the first and the second half of 2021, Service Portal happiness increased from -18 to 0, making it one of the most favored IT touchpoint (ahead of mobile devices, computers, and enterprise applications). Now mobile devices has taken its previous place as the lowest scoring IT touchpoint (at -1).
And yes, this is a tremendous upgrade, testament to data-driven improvement efforts to increase happiness and productivity in the area. However, Service Portals remain an IT touchpoint that employees don’t exactly favor from an experience perspective.
Expectations vs. reality in self-service
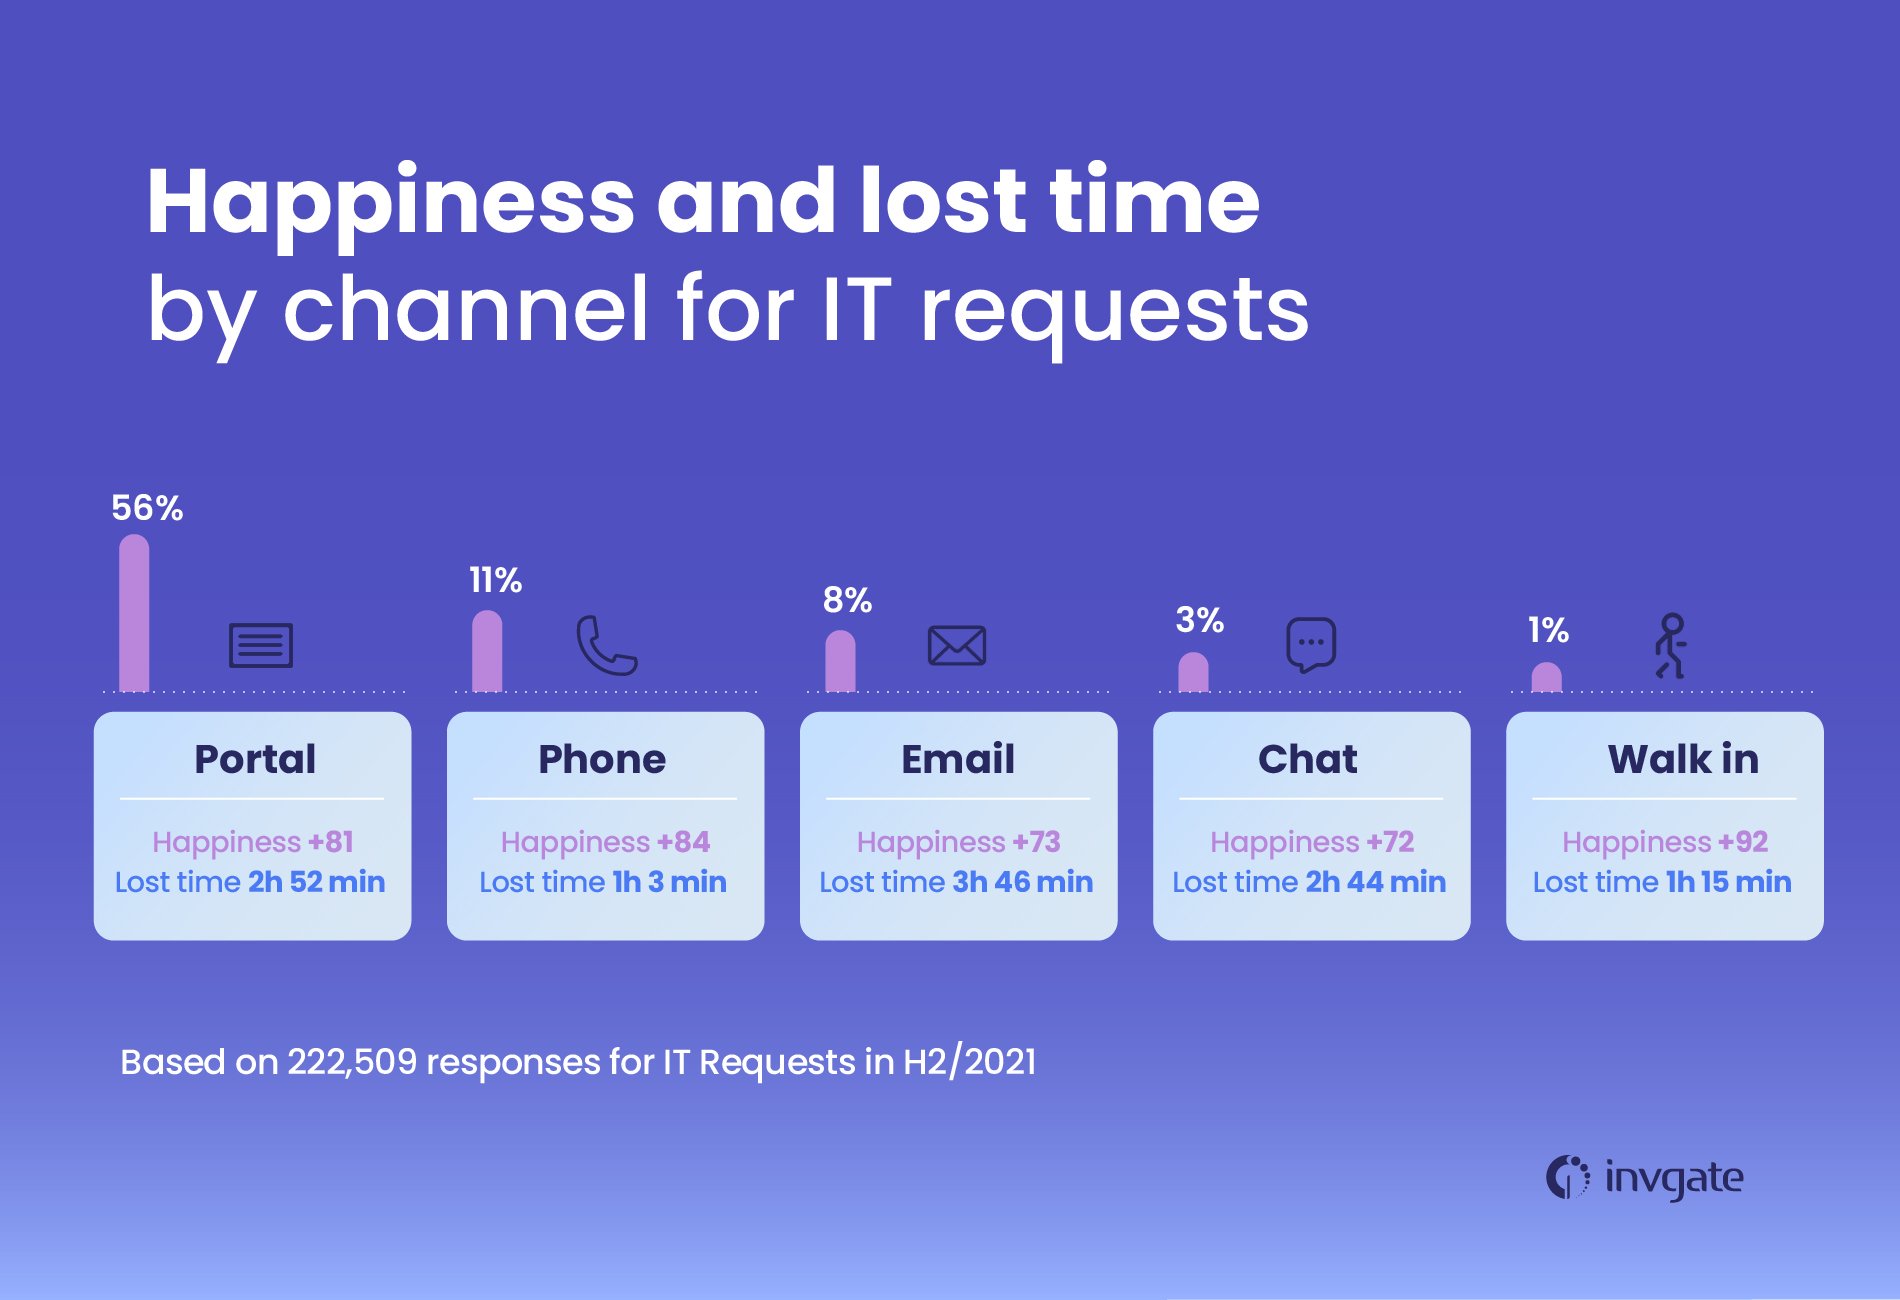
The report also identifies Service Portals as one of the main channels for IT incidents. This is great for adoption, but unfortunately self-service also feature the lowest level of Happiness for IT incidents. Employees also still report losing 78% more time when they’re using Service Portals than by picking up the phone to report incidents.
There’s a disconnect between the immediacy that self-service is supposed to represent and the everyday reality of employees.
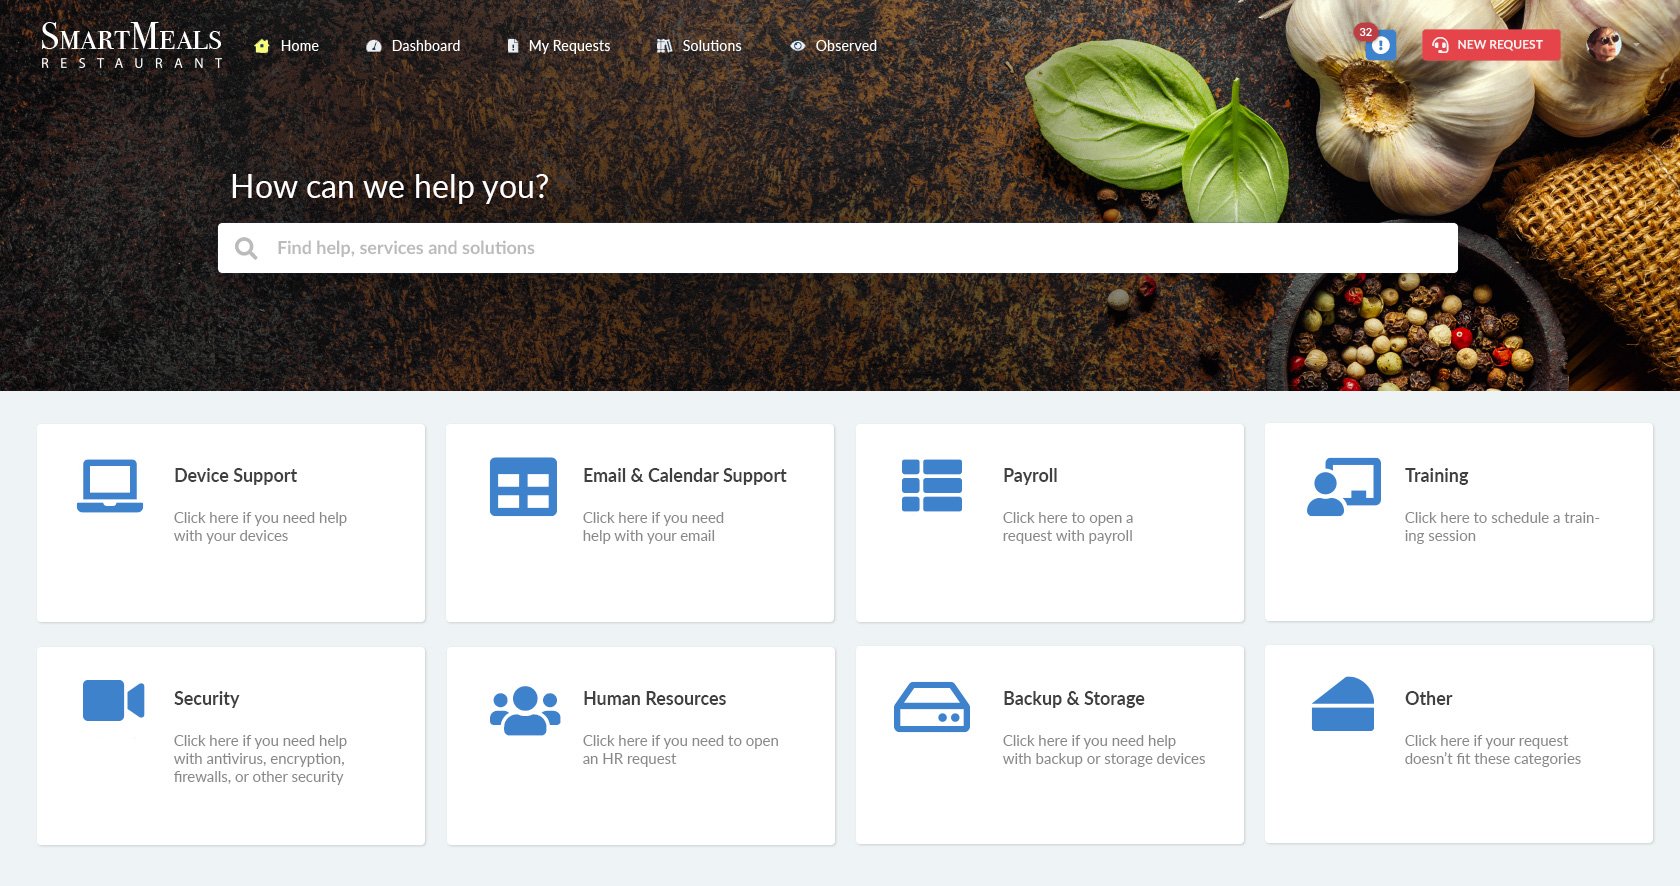
Creating a Service Portal that is clear, engaging, and easy to use is one thing – companies use ITSM tools such as InvGate Service Management to do precisely that – but it has to be accompanied with agile workflows that incorporate automation and feature a clear ticketing process flow in the back end.
InvGate Service Management allows for the easy creation and customization of self-service portals - plus, it follows seven laws of UX to improve the experience of IT managers. Companies can close the gap between expectation and reality of self-service with the combination of a smartly designed service catalog and robust knowledge base (prioritizing self-resolution), and clearly defined process flows (maximizing efficiency through routing and prioritizing).
Improvements in support for remote employees
Halfway through 2021, we spoke to several industry leaders to get their opinion on how IT teams can help support return-to-office strategies and hybrid work models. The consensus was clear - an immediate return to normalcy wasn’t happening any time soon, and companies needed to both:
- Facilitate work-from-anywhere (WFA) scenarios, and
- Provide more consistent support for remote workers
Looking back at the last 6 months, and the findings of this report, it’s clear that they were on to something. IT leaders surveyed recognized the importance of improving remote work support. The customer experience benchmarking report displays a clear increase in end-user happiness with remote work.
It’s true, though, that it’s hard to quantify remote worker experiences, so companies should still collect experience data from remote workers to make sure their experience-based feedback is properly processed and incorporated into your experience improvement strategy and decision-making.
This is why IT asset management has such a critical role in the work-from-home world. There’s a lot that plays into it, everything from issuing devices to offboarding of cloud-based applications used to facilitate work.
If an IT team is stuck in using spreadsheets and other manual, inefficient processes for tracking their IT assets, not only do they leave the company vulnerable to issues like incorrect asset mapping and security breaches, it also makes remote workers feel left in the lurch (affecting their overall experience).
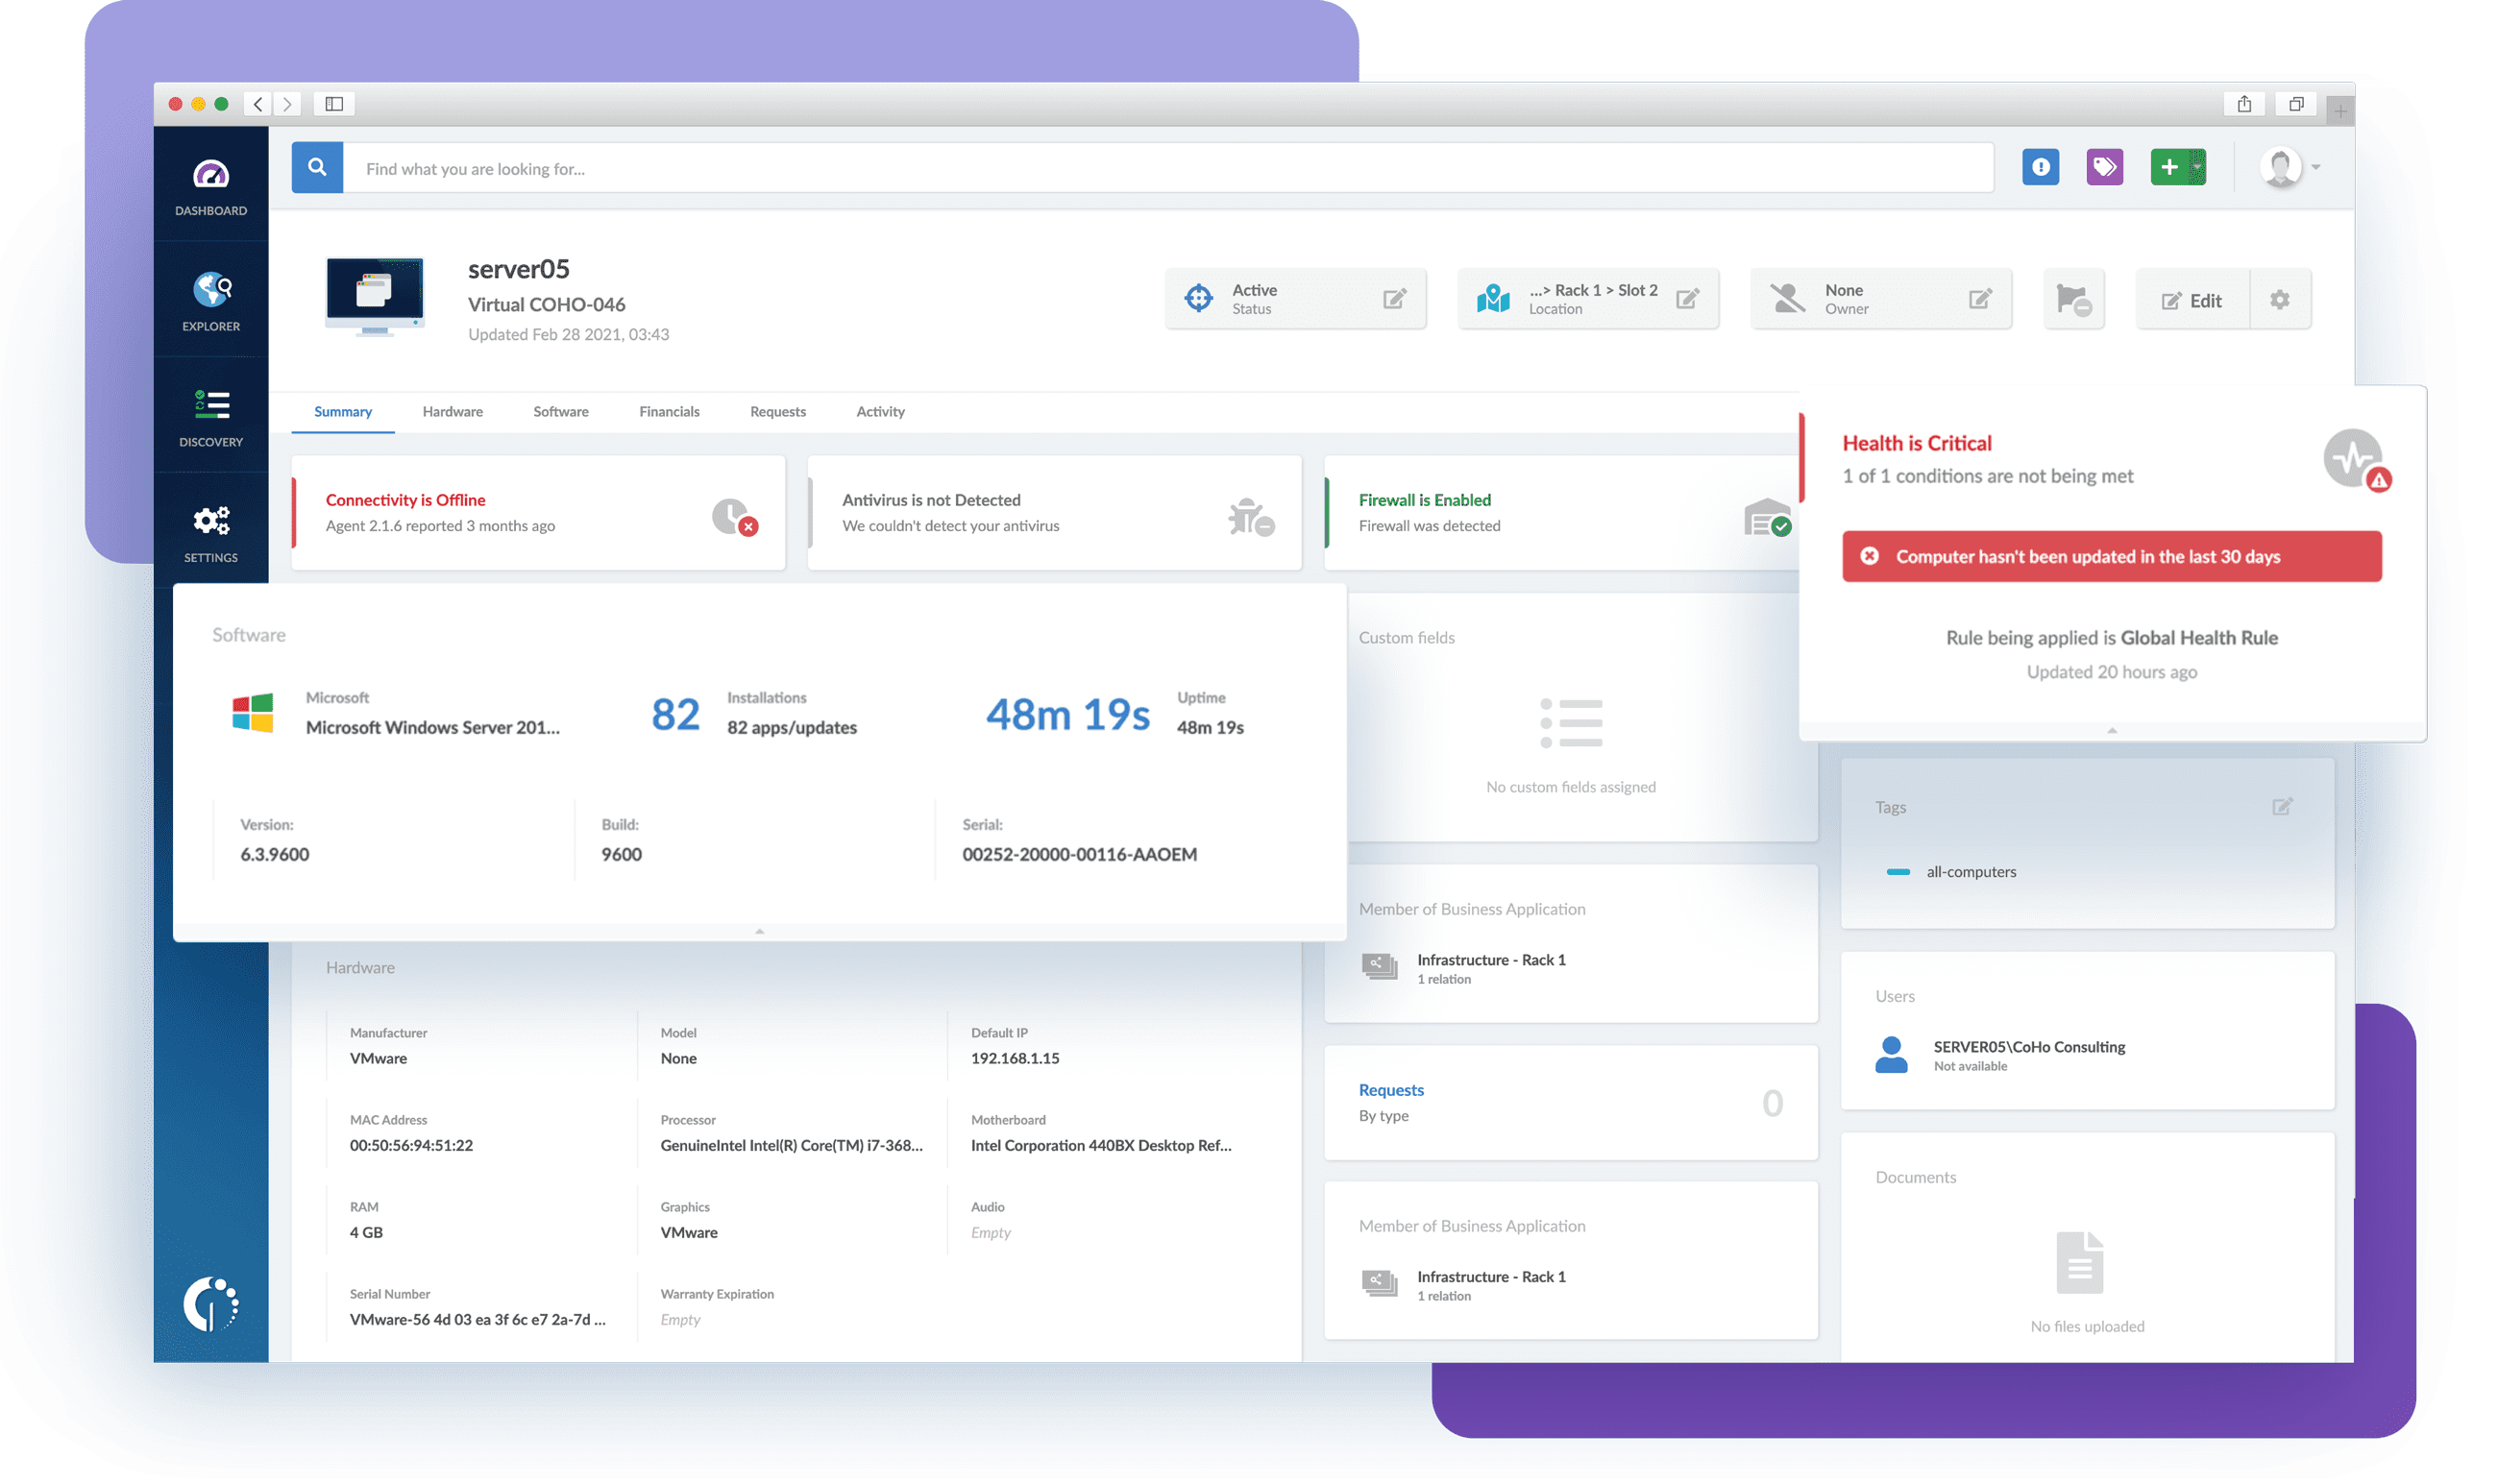
InvGate Asset Management is a comprehensive IT asset management solution that can track every IT asset in your organization throughout its lifecycle, associating it with a specific user or administrator and providing a bird’s-eye view of all assets.
Explore a live demo, or get a 30-day free trial to see how its state-of-the-art IT asset management capabilities can simplify your asset management strategy.

These were a few key takeaways from the Global IT Experience Benchmark Report. To learn more, check out the full report here.