


Site Reliability Engineering, or SRE, is a widely-used set of interdisciplinary practices that help increase the efficiency of software development. But, aside from that, its purpose is to create scalable, connected, reliable, communicated systems that keep providing better, more reliable results.
SRE leads to more connected, efficient organizations that can build resilient, iterable, and scalable software. To do this, SRE engineers leverage their coding expertise.
To aid in this quest, Google has developed a list of valuable metrics: the SRE signals. Today, we’ll review them to see how they can help you create the pipeline of your dreams.
Let’s take a look at what you need to track to succeed.
The importance of SRE metrics
SRE and the golden signals are so popular because Google published a comprehensive book about SRE. Plus, a few more tech giants are discussing the golden signals that you simply need to track if you want your system to be the best it can be as it scales — and that is both fast and reliable.
Just by taking the time to identify reliability concerns and team-building with this in mind, it’s very likely that you’ll have managed to integrate both reliability and testing earlier in the software development pipeline.
Considering that these signals are much harder to track than just CPU speed or RAM performance, each service requires a little something extra to measure effectively. Each has different definitions, metrics, and associated tools.
Things like Containers, Microservices, and Serverless can make getting signals even more difficult. But since these signals are so important, you can (and will have to) go a bit out of your way to get them. Mainly because they can help troubleshoot your distributed systems effectively and avoid traditional alert noise.
Let’s look at the three methods that can help you track these important SRE metrics.
The USE Method
USE, a hardware-related monitoring method, comes from:
- Utilization: the percentage of time a resource is active.
- Saturation: the amount of “effort” a given resource must perform (often queue length).
- Errors: how many error events take place at a given time.
RED
Red is a service-related monitoring method, and it comes from:
- Rate: the number of requests per second.
- Errors: the number of failed requests you’ve got on your hands.
- Duration: how long those requests take.
The golden signals
Now, we finally come to the much-vaunted golden signals. These are Kubernetes-related metrics. They are:
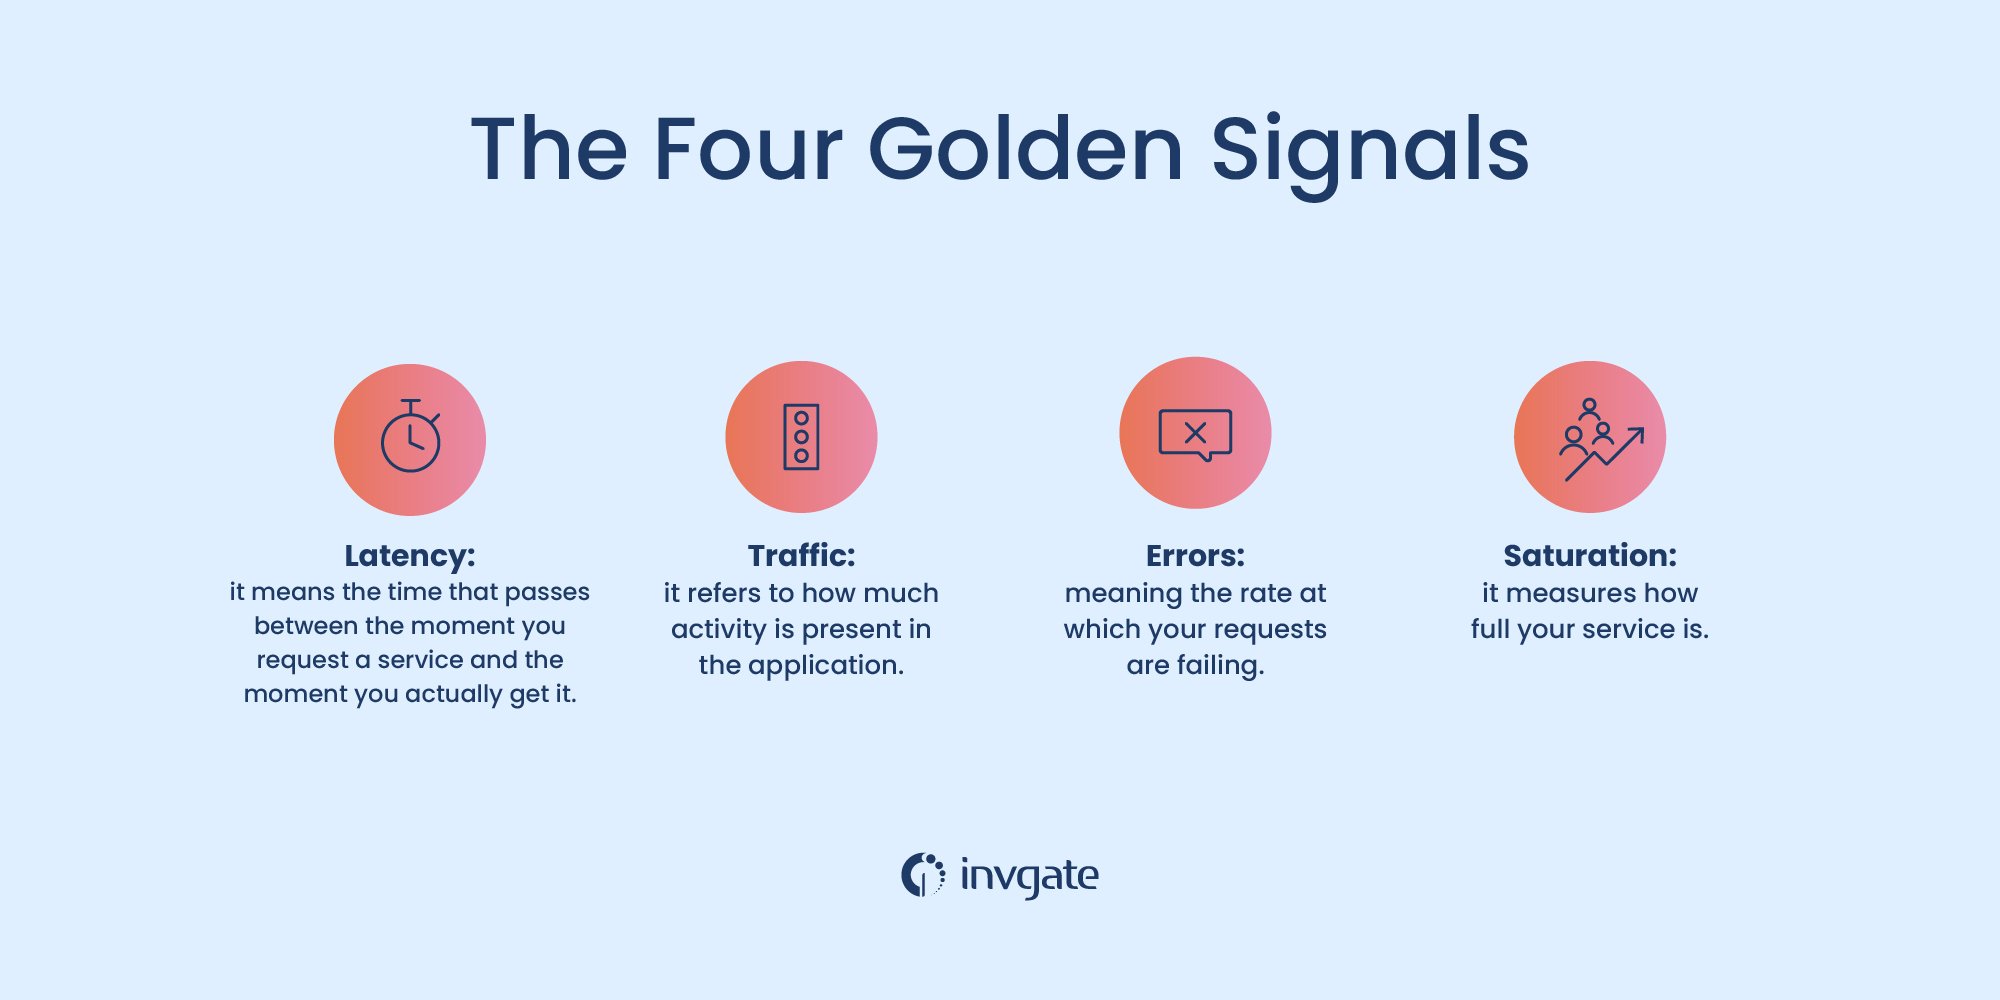
- Latency: time needed to fulfill a request.
- Traffic: how much demand your system is under.
- Errors: the rate of requests that fail.
- Saturation: it’s about how overloaded your system is.
Let’s dive deeper into these signals.
The four golden signals
Now that we’ve established these signals, the rest is to determine what they do and how to measure them accurately.
Latency
Latency means the time between you requesting a service and getting it. It’s also known as response time, and measuring both the latency and service-to-service latency is crucial. You’ll be able to establish a baseline. If you cannot meet that baseline, it’s a clear sign of application degradation.
Another thing to remember is that averages can be misleading, so use histograms whenever possible. This way, you’ll be able to establish values based on percentile thresholds, a more accurate way to measure this signal.
The 95th or 99th percentile values can help detect flagging performance in a request or component. Also, you should monitor error latency too; one long-term bad-performing transaction can bleed into demands.
Traffic
Traffic refers to how much activity is present in the application. Of course, you can expect different values depending on the type of application you’re running, so it’s not universal.
If possible, we discourage using averages for this metric as well. Some examples of traffic can include how many requests an API has handled. The bandwidth consumed to stream a particular software or the number of connections to a server.
Errors
In plain English, errors mean the rate at which your requests fail. More overt errors, like HTTP 500s. That doesn’t mean you can rest on your laurels since some errors may not appear as errors —measure stem or measure errors in rates.
The idea for errors is to inform you about application bugs, dependency failures, or service misconfigurations. Also, error rates can affect other measurements, like increasing or lowering saturation. Not good, since you need those other measurements like you need air.
Saturation
Saturation measures how full your service is. We don’t mean full like sitting at a restaurant, but rather how much you’re taxing your service. There’s no universal way to measure saturation; it’s challenging because the type of application you’re running affects the saturation metrics. Therefore, you need flexible utilization metrics to get a lead.
Here are some examples that you can use to determine saturation:
- 99th percentile for latency.
- Memory and CPU usage for all applications.
- Disk Input/Output rates for all databases and streaming applications.
- Memory, heap, and thread pool garbage collection for all Java-based applications.
Another thing to be on the lookout for is that application services usually start to degrade way before a metric reaches 100% utilization.
Setting up the metrics for all golden signals
For starters, setting up the metrics for all four signals in your applications can take a while. The easiest, fastest way to do it is to shift left and monitor and test applications early in the development and load-test phases. Get a clear glimpse of performance characteristics before it’s game time.
Once the signals are set up, you’ll have a much easier time understanding whether you need extra monitoring. Or, in other ways, you’ll already have the means to achieve higher system observability.
A great way to do it is to apply the golden signals to the following activities:
- Black-box or synthetic monitoring
- Monitor the user experience
- Get a clear view of application runtimes
- Create actionable, useful dashboards that provide single-view information about your monitoring component
Another thing to keep in mind is that the four golden signals are your first step to meaningful monitoring. Real-time tracking of all four will help your teams get issues under control much faster. Also, they give your teams a bird’s eye view of the health of all of your services, even if they’re not necessarily under their purview.
In short, it’s about:
- Alerting: keeping you apprised when things aren’t working as they should.
- Troubleshooting: helping you fix the problem.
- Capacity planning: proactively make things better over time to decrease vulnerability.
And these things don’t just help with incident management but also the entire incident lifecycle (over time).
Summing up
Getting all four golden signals in place means having a much greater understanding of the health of your system. In turn, that will lead your team to spot issues and reduce the likelihood of those issues appearing again in the future. Measuring traffic, saturation, errors, and latency is key to establishing an application baseline that should serve as a gold standard — a bar your applications can never dip below.
And while there are different ways to track them, you’re not going to get out of implementing these signals anytime soon. Measuring them correctly is one of the most important factors in making your application lifecycle as reliable and error-free as possible as it can be from the outset.
The result is a “cleaner” development pipeline, with fewer errors, a faster response rate to errors, and much more control over every process step for every team member.
Frequently Asked Questions
What is SRE monitoring?
It means keeping track of important golden metrics to ensure that your application lifecycle is as free of errors and efficient as possible. If not, you’re opening up to more and more vulnerabilities over time or repeating the same errors.
Why do we need SRE?
Site Reliability Engineering is there to maintain communication between the development teams, which helps keeps them working towards the same goal. This decreases organization siloing (separation/isolation) and creates a much tighter bond between teams, thanks to the site reliability engineers, who have both coding and operations experience.
What is SRE in Google?
Ben Treynor, a Google engineer, coined Site Reliability Engineering in 2003. His efforts gave rise to the now-burgeoning SRE industry, a massive compliment to DevOps and, in turn, to the software development industry.

